

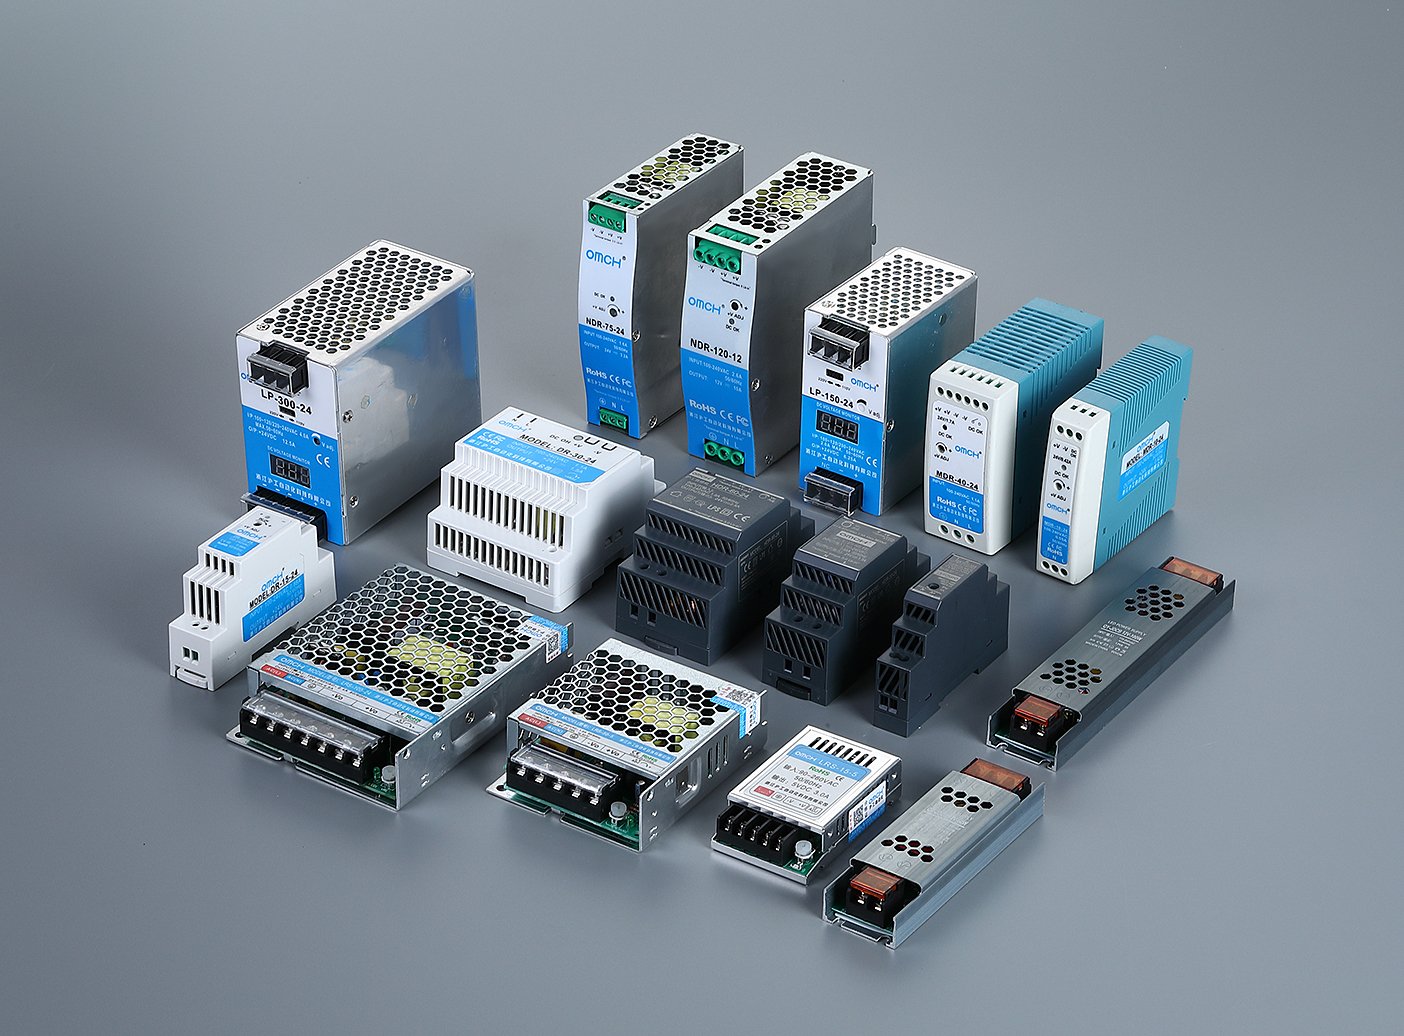
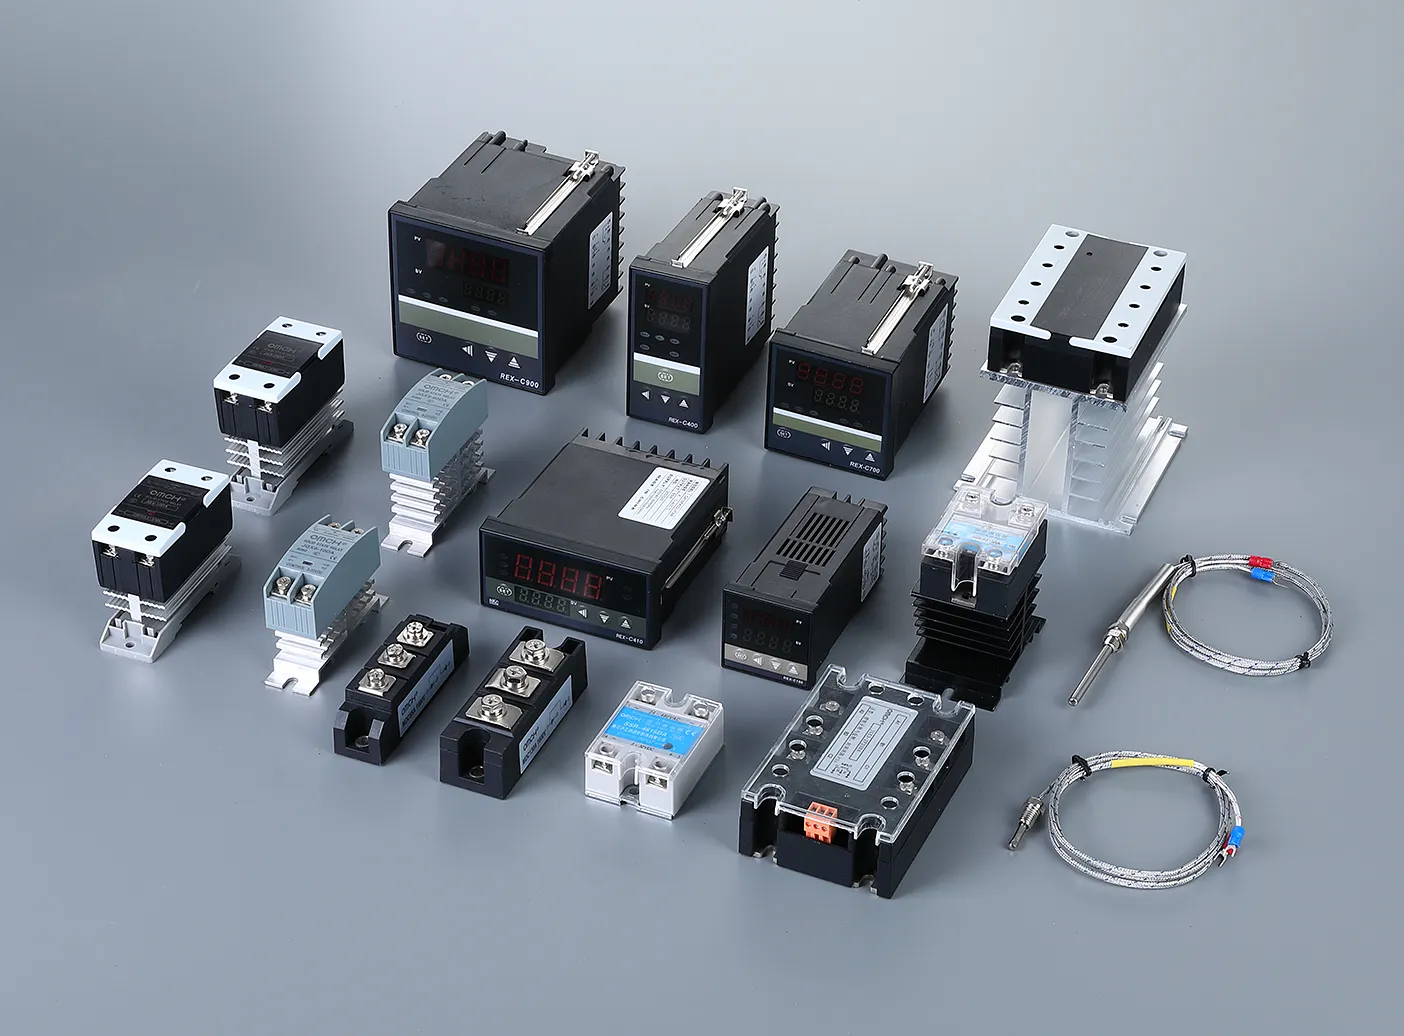
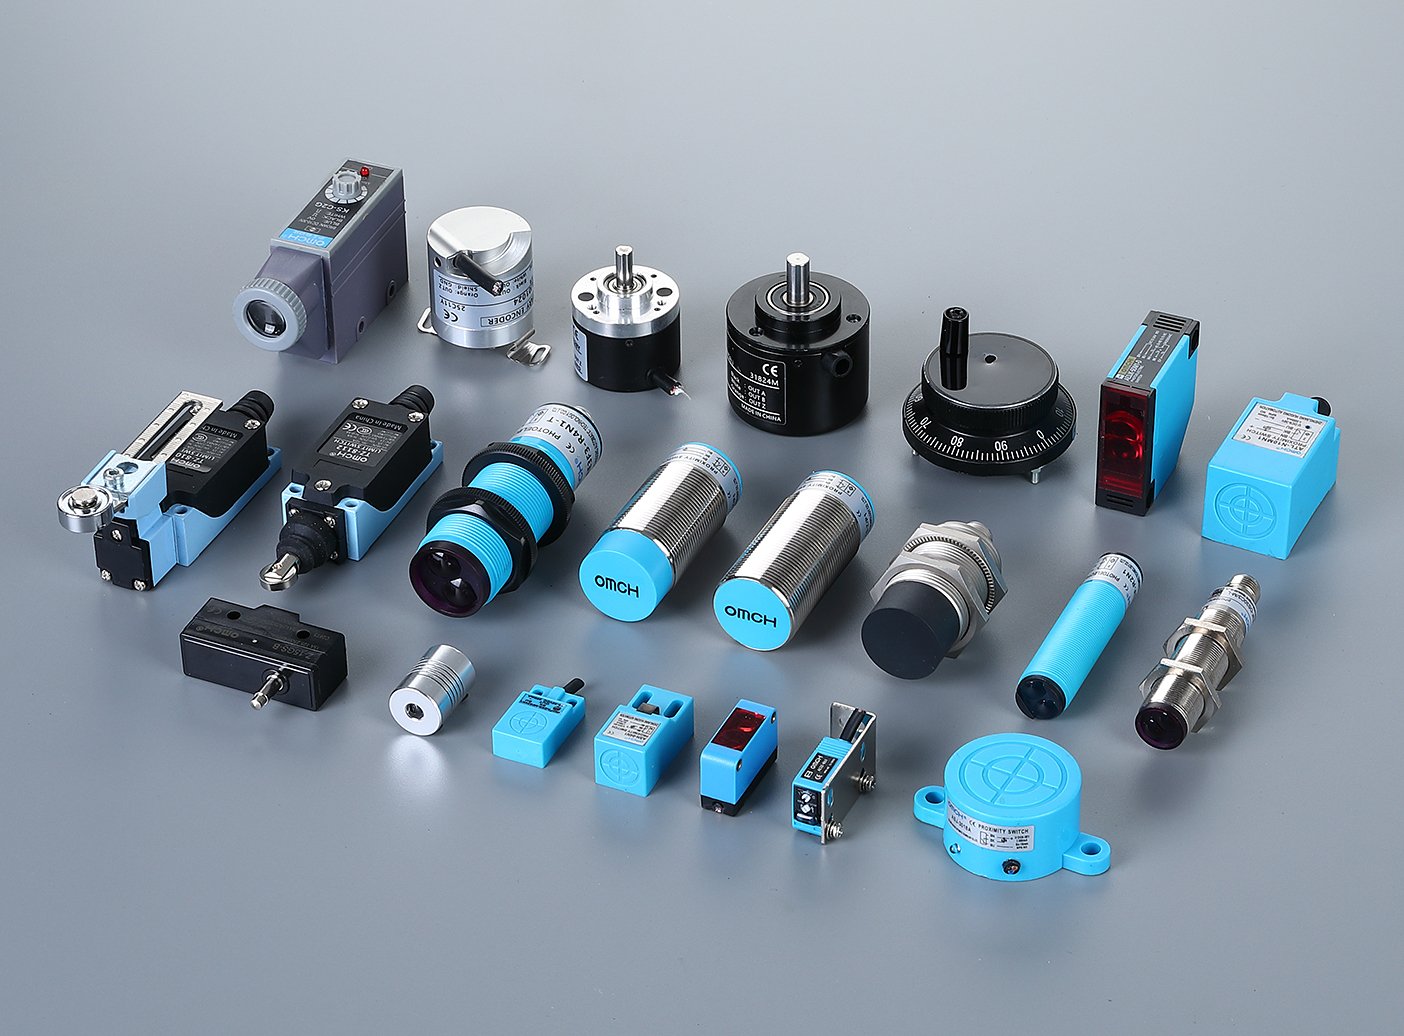
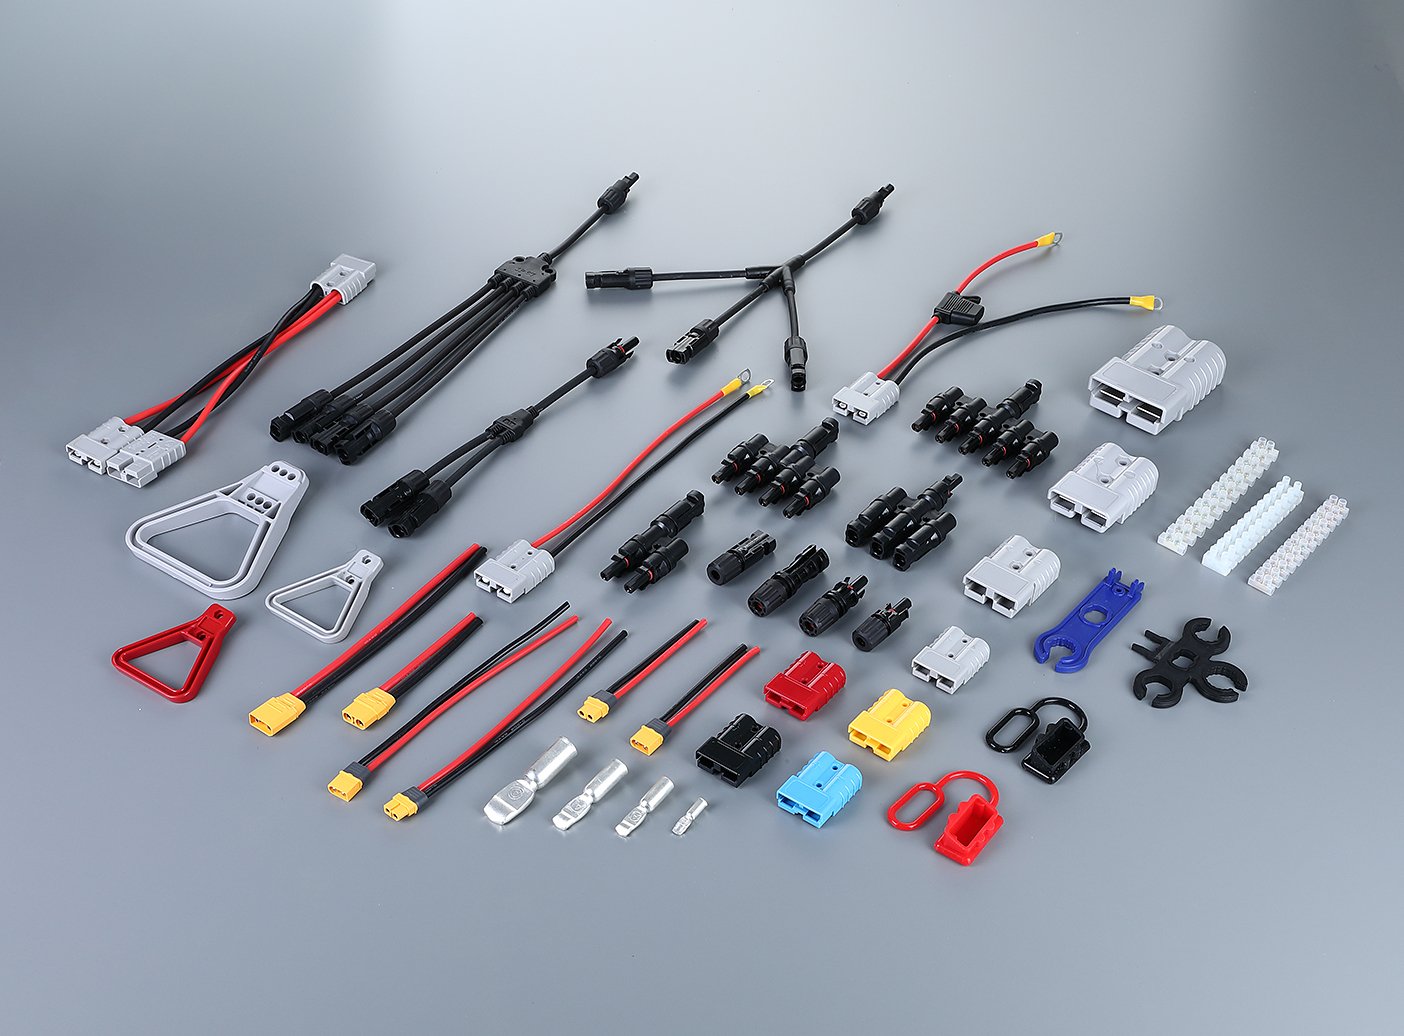
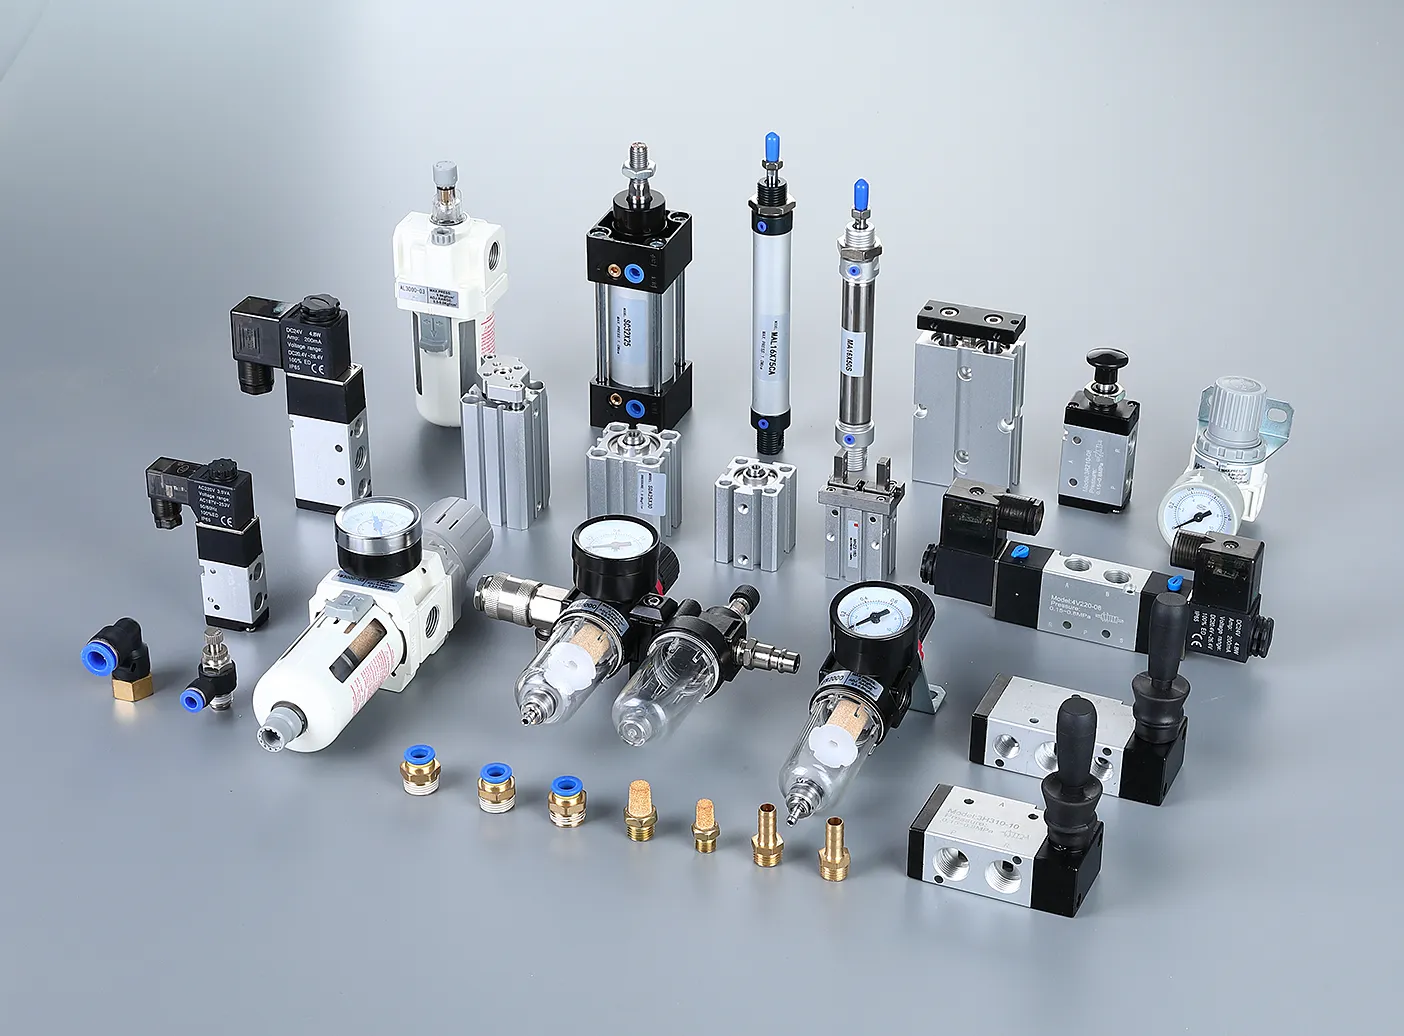
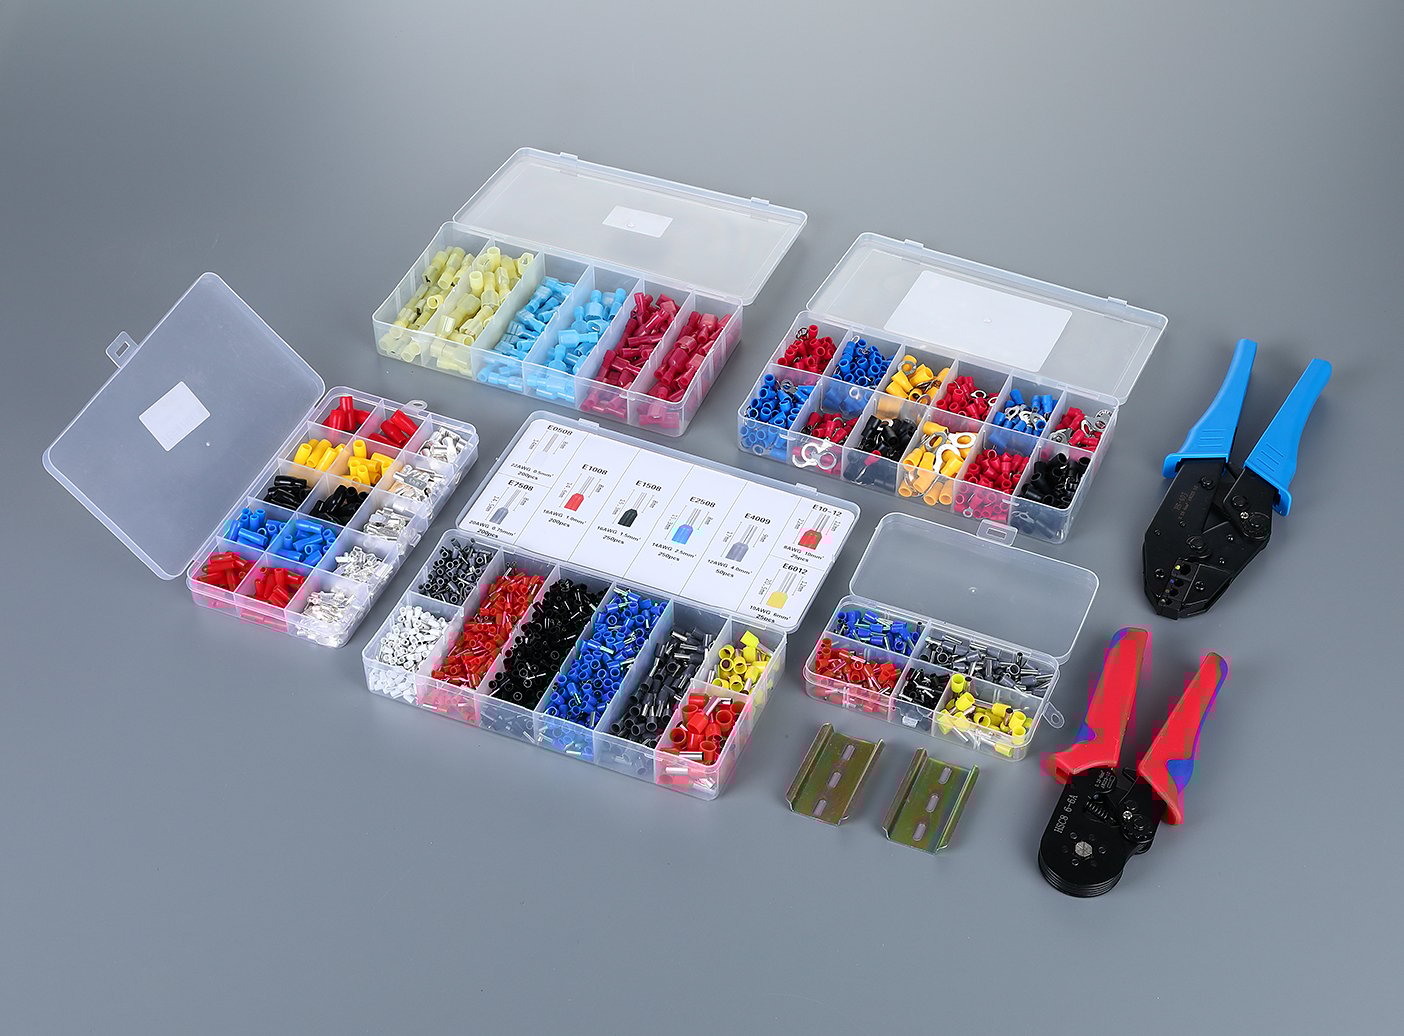

Когда люди слышат словосочетание “электрические компоненты”, они часто представляют себе крошечные микросхемы и конденсаторы внутри смартфона. Однако производство электрических компонентов охватывает гораздо более обширную и промышленную сферу — оно является основой каждого производственного цеха, распределительного щита и автоматизированной производственной линии на планете.
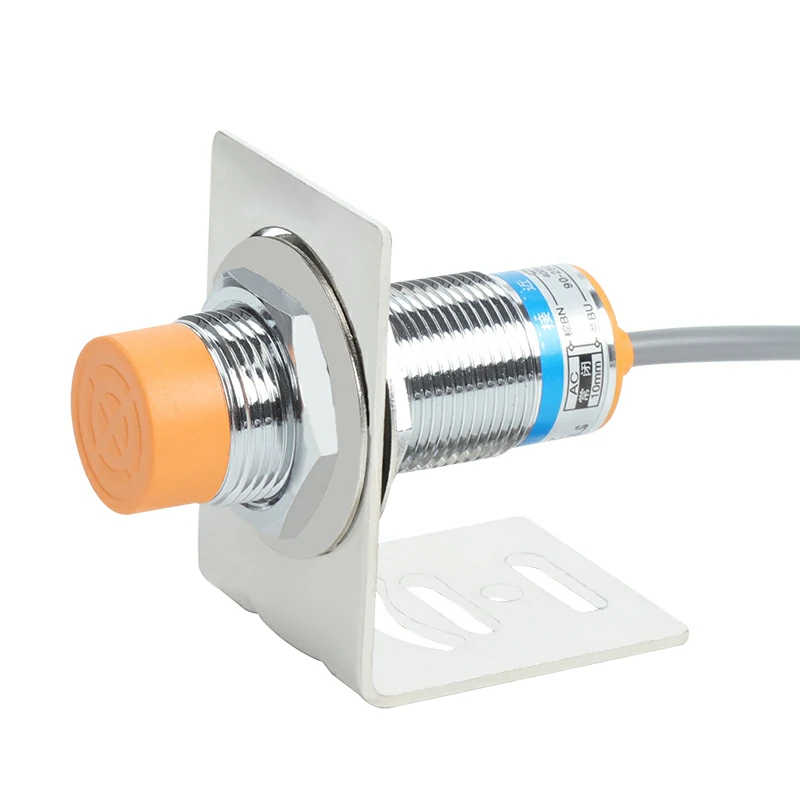
Электрические компоненты — это не то же самое, что электронные компоненты. Это различие имеет значение. Электронные компоненты — интегральные схемы, микропроцессоры, микросхемы памяти — размещаются на печатных платах и обрабатывают сигналы на уровне милливольт. Электрические компоненты работают с реальной мощностью: они включают, защищают, распределяют и преобразуют электричество при напряжениях от 24 В постоянного тока в цепях управления до 1000 В переменного тока в сетях электроснабжения. Речь идет об автоматических выключателях, контакторах, датчиках приближения, промышленных реле, импульсных источниках питания, концевых выключателях, электромагнитных клапанах и клеммных колодках — тех деталях “органного уровня”, которые заставляют промышленное оборудование «дышать», двигаться и безопасно останавливаться.
Только мировой рынок электронных компонентов в 2024 году оценивался примерно в $498 млрд, а по прогнозам к 2029 году его объем достигнет $735 млрд. Однако эта цифра не в полной мере отражает масштабы более широкого сектора электрических компонентов, который — с учётом низковольтного распределительного оборудования, компонентов промышленного управления, датчиков и электромеханических устройств — увеличивает общий потенциальный рынок в совокупности взаимосвязанных вертикальных рынков значительно выше отметки в один триллион долларов.
Производственные мощности в значительной степени сосредоточены в Азии. Китайская провинция Чжэцзян — в частности, коридор Юэцин–Вэньчжоу — превратилась в самый плотный в мире кластер по производству низковольтного электрооборудования, где выпускается большая часть автоматов, контакторов и источников питания, реализуемых на мировом рынке. Ось Шэньчжэнь–Дунгуань в провинции Гуандун доминирует в сегменте пассивных компонентов, реле и сборок на уровне печатных плат. Шанхай и его прилегающие города занимают ключевое положение в сегменте высоковольтного оборудования и интеллектуальных энергосистем. За пределами Китая Япония и Южная Корея лидируют в производстве прецизионных пассивных компонентов (MLCC от Murata и Samsung Electro-Mechanics), Германия и Швейцария — в сфере сверхнадежных систем промышленного управления, а США — в производстве полупроводников и специализированных компонентов оборонного назначения.
Вот что наиболее важно: эта отрасль не является монолитной. В любой категории продукции — например, импульсных источников питания на DIN-рейке — можно найти заводы, выпускающие устройства, по своим характеристикам приближающиеся к аэрокосмическим стандартам, с КПД 92%+ и расчётным сроком службы 10 лет; заводы, производящие надёжные продукты среднего ценового сегмента по конкурентоспособным ценам для общепромышленного применения; а также заводы, выпускающие устройства, которые внешне выглядят идентично, но в которых на всех внутренних компонентах экономится на качестве. Разница в цене между верхним и нижним ценовыми сегментами может составлять 3 и более раз — и для дистрибьютора, работающего на рынках, чувствительных к цене, умение определить, какой сегмент подходит какому клиенту, является тем навыком, который отличает прибыльный бизнес от постоянной работы с жалобами.
Представьте себе рынок автомобильных запчастей: требованиям одной и той же спецификации “тормозных колодок” могут соответствовать как запчасть OEM-класса от поставщика первого уровня, так и запчасть от известного бренда вторичного рынка, или же безымянная запчасть от завода, о котором вы никогда не слышали. Все три варианта подходят для одной и той же машины. Но только с двумя из них вы хотели бы, чтобы ваше имя ассоциировалось. Остальная часть этого руководства посвящена тому, как приобрести знания, позволяющие отличить одно от другого — даже не будучи инженером.
Как производятся электрические компоненты: три этапа контроля качества
Существует одна неприятная правда, касающаяся производства электрических компонентов: два завода могут выполнять одни и те же этапы производства, использовать оборудование одной и той же марки и выпускать компоненты с одинаковым артикулом — и тем не менее один из них поставляет продукцию, которая служит десять лет, а у другого уже через шесть месяцев начинают накапливаться случаи отказов в эксплуатации. Разница заключается не в том, используют ли они иметь каждый этап производства. Это проявляется в тщательности выполнения на каждом контрольном пункте качества.
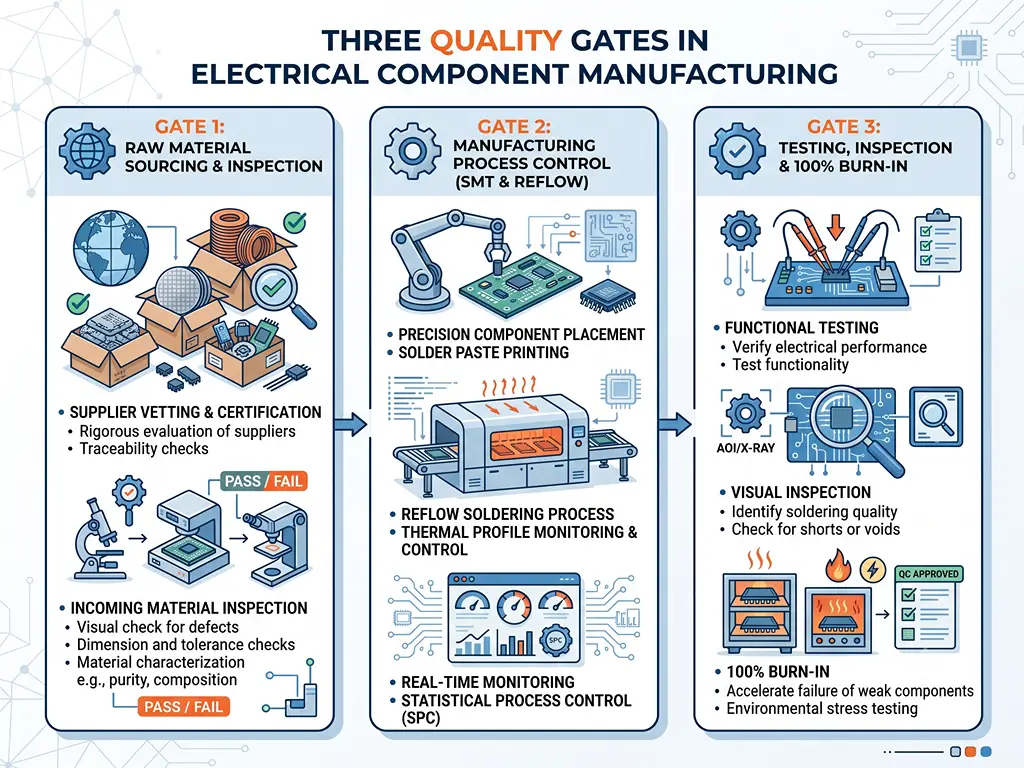
Этап 1: Закупка сырья и входной контроль
Качество любого электрического компонента во многом определяется ещё до того, как он попадает на производственную линию. На долю материалов приходится 50–70% себестоимости компонента — и именно поэтому сокращение затрат в первую очередь затрагивает именно их.
Возьмем, к примеру, неприметный электрический контакт внутри реле или контактора. На первый взгляд все контакты выглядят как небольшие диски серебристого цвета. Но именно состав материала определяет всё: сколько циклов работы выдержит переключатель, насколько сильно он нагревается под нагрузкой и не заварится ли он при коротком замыкании. Оксид серебра и кадмия (AgCdO) на протяжении десятилетий был отраслевым стандартом — он отличался превосходным подавлением дуги и длительным сроком службы. Однако кадмий токсичен и его использование ограничено директивой RoHS. Современной заменой является оксид серебра и олова (AgSnO₂), который соответствует экологическим требованиям, но требует более строгого контроля процесса спекания для достижения сопоставимых характеристик. Завод, стремящийся сократить затраты, может использовать сплав с более низким содержанием серебра и уменьшенной дисперсией оксидов — на фотографии контакт выглядит идентично, но его электрический ресурс снижается с 200 000 циклов до, возможно, 50 000.
Эта закономерность повторяется во всех категориях материалов. Медная проволока для обмоток трансформаторов: чистота 99,91 TP3T по сравнению с 99,51 TP3T — разница в 0,41 TP3T, которая изменяет удельное сопротивление настолько, что рабочая температура повышается на 5–8 °C, что с годами ускоряет износ изоляции. Листы кремниевой стали для сердечников двигателей и трансформаторов: марка B50A470 (с низкими потерями на железо) по сравнению с B50A1300 (стандартная) — сталь более низкого качества теряет в три раза больше энергии в виде тепла на килограмм материала сердечника. Корпуса из инженерного пластика: первичный поликарбонат или PA66 по сравнению с переработанным измельчённым материалом — последний становится хрупким после 2–3 лет термоциклирования, и корпус вашего клиента расколется на крыше в Дубае.
На данном этапе серьезных производителей от тех, кто стремится сократить расходы, отличает не то, заявляют ли они о “проверке поступающих материалов”, а то, могут ли они предоставить вам спецификацию поступающих материалов с минимальными критериями приемки — прочность на разрыв, индекс текучести расплава, допуск по толщине покрытия — и могут ли они проследить любую готовую партию до партии сырья, из которой она была изготовлена.
Этап 2: Управление производственным процессом
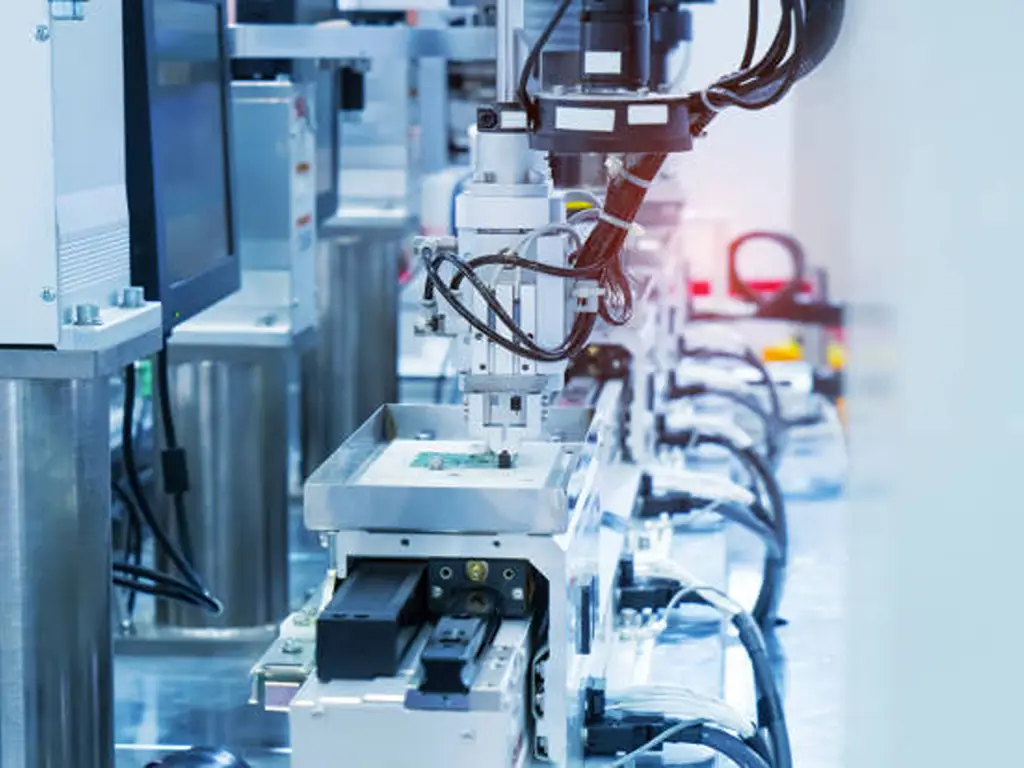
Зайдите на любой завод по производству электрокомпонентов, и вы увидите похожее оборудование: машины для поверхностного монтажа (SMT), печи для рефло-пайки, станции для пайки волной припоя, автоматизированные сборочные линии, испытательные станции. Сам по себе перечень оборудования практически ничего не говорит. Важны класс точности, дисциплина технического обслуживания и стабильность технологических параметров.
Машина для поверхностного монтажа — это не просто “машина для SMT”. Линия высокого класса обеспечивает точность размещения ±25 мкм при 3σ со скоростью размещения, превышающей 80 000 компонентов в час. Десятилетний станок среднего класса, возможно, всё ещё способен размещать компоненты, но с точностью ±75 мкм и со скоростью, вдвое меньшей — а если он не калибровался в течение 18 месяцев, эти цифры являются лишь ориентировочными, а не реальными. Разница в точности размещения напрямую влияет на надёжность паяных соединений на компонентах с мелким шагом.
Процесс пайки методом рефлоу еще более показателен. Бессвинцовый припой (в настоящее время являющийся стандартом в соответствии с директивой RoHS) требует точного температурного профиля: зона предварительного нагрева при 150–180 °C в течение 60–90 секунд, плавный набор температуры до пикового значения 235–245 °C, при этом время пребывания выше температуры ликвидуса (220 °C) должно составлять от 60 до 90 секунд. Отклонение на 10 °C или 10 секунд за пределы этого диапазона приводит либо к образованию холодных паяных соединений (хрупких, склонных к растрескиванию), либо к чрезмерному росту интерметаллических соединений (ослабление прочности соединения). Ни один из этих дефектов не виден невооруженным глазом. Оба приводят к периодическим сбоям, которые сводят ваших клиентов с ума — продукт “работает, когда я его тестирую, но выходит из строя, когда клиент его устанавливает”.”
Третьим аспектом является то, что происходит после сборки. Каждый блок питания, реле или датчик, покидающий завод, должен пройти испытания на выжигание — работу изделия при полной номинальной нагрузке в течение длительного периода, чтобы выявить отказы на ранней стадии срока службы (“младенческая смертность”) на заводе, а не в условиях эксплуатации. Для промышленных источников питания «золотым стандартом» является испытание на выгорание по методу 100% при полной нагрузке в течение 48 часов. Завод, проводящий 4-часовое выборочное испытание на выгорание, статистически гарантирует, что определенный процент ранних отказов дойдет до ваших клиентов.
Представьте себе, что это как выпечка: одинаковый рецепт, одинаковая модель духовки — но один пекарь еженедельно калибрует духовку и проверяет внутреннюю температуру с помощью датчика, а другой просто следит за таймером и надеется на лучшее. Оба получают пирог. Но только один из них получает одинаковый пирог каждый раз.
Этап 3: Тестирование, контроль и обеспечение качества
“Проверено по стандарту 100%” — это самое распространённое заявление в сфере производства электрических компонентов — и самое вводящее в заблуждение. Вопрос не в том, или тестирование проводится. Вопрос в том, что проходит тестирование, против чего стандартный, и обеспечивается ли прослеживаемость данных.
Надлежащая пирамида тестирования состоит из четырёх уровней. Контроль качества поступающих материалов (IQC) проверяет соответствие сырья и закупаемых комплектующих техническим требованиям до их поступления в производство. Тестирование на линии сборки (ICT) проверяет отдельные печатные платы на правильность размещения компонентов, целостность паяных соединений и основные электрические параметры. Функциональное тестирование (FCT) включает готовый продукт в рабочий режим и проверяет, выполняет ли он свои назначенные функции в условиях нагрузки. Тестирование на надежность — выжигание, термоциклирование, вибрация — подтверждает, что продукт выдержит условия эксплуатации, предусмотренные для него, в течение всего ожидаемого срока службы.
Если завод проводит “тестирование по методу 100%”, это может означать, что они включают каждое устройство и проверяют, загорается ли светодиод. Это не тестирование. Это проверка включения. Настоящее функциональное тестирование подразумевает подачу номинальной нагрузки, измерение выходных параметров в сравнении с пределами, указанными в технических характеристиках, и запись результатов. Настоящее тестирование на надежность подразумевает статистический контроль процесса с документированными значениями Cpk — индекс способности процесса ≥1,33 является минимально приемлемым порогом для производственного процесса промышленного качества, а ≥1,67 свидетельствует о хорошо контролируемом и предсказуемом процессе.
Есть ещё один аспект, о котором большинство покупателей даже не задумываются: видимость дефектов. Автоматический оптический контроль (AOI) использует камеры для проверки качества паяных соединений на видимых поверхностях — он выявляет около 80–90% распространённых дефектов. Однако он не может заглянуть под корпус типа Ball Grid Array (BGA), где паяные шарики расположены между микросхемой и печатной платой. Для этого требуется рентгеновский контроль (AXI). Завод, который использует только AOI, по сути говорит вам: “Мы проверяем то, что видим. То, что скрыто, остаётся скрытым”.”
Практический совет: при оценке заявлений производителя об испытаниях задайте три вопроса. Можете ли вы предоставить отчет по показателю Cpk для последней производственной партии моего продукта? Каков ваш порядок принятия корректирующих мер в случае, если партия не проходит выходной контроль — можно ли увидеть недавний пример? И какое испытательное оборудование используется для проверки тех частей продукта, которые я не могу осмотреть визуально?
Материал Процесс Тест. На каждом заводе присутствуют эти этапы. Разница между компонентом со сроком службы 10 лет и компонентом со сроком службы 6 месяцев заключается в глубине реализации на каждом этапе — а не в том, существует ли этот этап.
Разъяснение стандартов качества: что действительно важно для электрических компонентов
Пройдитесь по любой выставке электротехнического оборудования, и вы увидите технические паспорта компонентов, испещрённые логотипами сертификатов — CE, UL, CCC, RoHS, ISO, IEC и ещё полдюжины других. Некоторые из них являются обязательными требованиями для выхода на рынок. Некоторые — значимыми показателями качества. А некоторые — просто украшением. Умение различать их — ключевой навык для любого дистрибьютора, занимающегося закупками на международном рынке.
Сертификаты безопасности: CE, UL, CCC и разрешения на доступ к региональным рынкам
Сертификаты безопасности — это своего рода “визовая” система для электрических компонентов: нет визы — нет доступа на рынок. Однако для разных рынков требуются разные визы, и они не являются взаимозаменяемыми.
В Европейском союзе маркировка CE является обязательной для большинства электротехнических изделий, подпадающих под действие Директивы о низковольтных устройствах (2014/35/EU, охватывающей диапазон напряжений 50–1000 В переменного тока) и Директивы об электромагнитной совместимости (2014/30/EU). Важный нюанс: маркировка CE для многих категорий продукции осуществляется на основе самодекларации производителя — производитель заявляет о соответствии, и привлечение независимой испытательной лаборатории не требуется. Маркировка CE, подкрепленная сертификатом испытаний, выданным уполномоченным органом, существенно отличается от маркировки CE, основанной на самодекларации, однако логотип на изделии выглядит одинаково.
Для Северной Америки сертификация UL (или эквивалентная сертификация CSA или ETL) является фактическим требованием. UL различает статусы “Listed” (полная сертификация конечного продукта — именно этот знак ищут покупатели и инспекторы) и “Recognized” (сертификация на уровне компонентов, актуальная для производителей оригинального оборудования, которые включают данную деталь в более крупную сборку). Реле с маркировкой «Recognized» по стандарту UL подходит в качестве компонента; его не следует продавать в качестве самостоятельного конечного продукта конечному пользователю, который ожидает наличие маркировки «Listed» по стандарту UL.
В Китае система обязательной сертификации CCC (China Compulsory Certification) распространяется на продукцию, включенную в каталог CCC, — в том числе автоматические выключатели, контакторы и некоторые виды выключателей. Продукция, не входящая в каталог, может добровольно получить маркировку CQC. Распространенная проблема: дистрибьюторы, закупающие продукцию у китайских заводов исключительно для экспортных рынков, иногда получают товары с маркировкой CCC, которые не соответствуют требованиям CE или UL, поскольку критерии испытаний и допустимые пределы в этих системах различаются.
Быстрый способ проверки: попросите номер сертификата, а не просто фотографию логотипа. Каждый легитимный орган по сертификации ведет общедоступную базу данных сертификатов. Если поставщик не может предоставить номер сертификата, который вы можете самостоятельно найти, считайте заявление о сертификации неподтвержденным.
Стандарты управления качеством: ISO 9001 и не только
ISO 9001:2015 — это наиболее широко признанный стандарт системы управления качеством, а также тот, который чаще всего неправильно понимают. Сертификат ISO 9001 подтверждает, что в компании существуют документированные процессы управления качеством, а не то, что её продукция является качественной. Он гласит: “На этом предприятии существует система контроля за процессом производства”. Он не гласит: “Продукция, выпускаемая этим предприятием, является надёжной”.”
Практическое различие имеет огромное значение. Завод, сертифицированный по стандарту ISO 9001, по-прежнему может выпускать посредственную продукцию — просто она будет стабильно посредственной, причём на заводе существуют задокументированные процедуры рассмотрения жалоб на её низкое качество. И наоборот, завод, не имеющий сертификата ISO 9001, может выпускать отличную продукцию благодаря квалификации своей инженерной команды, но при этом не может гарантировать, что завтрашняя партия будет соответствовать сегодняшней.
Для проверки соответствия требованиям стандарта ISO 9001: убедитесь, что орган по сертификации является членом-подписантом IAF (Международного форума по аккредитации) — сертификаты, выданные органами, не входящими в IAF, имеют ограниченное международное признание. Проверьте сферу действия сертификации — охватывает ли она конкретную категорию продукции, которую вы приобретаете? Сертификат ISO 9001 на “производство электрических выключателей” не распространяется на источники питания. Также проверьте дату последнего надзорного аудита — стандарт ISO 9001 требует проведения ежегодных надзорных аудитов; сертификат, последний аудит которого был проведен 18 месяцев назад, возможно, уже приостановлен.
Стандарты производительности для конкретных продуктов: IEC, IPC и что означают эти цифры
Если сертификаты безопасности — это виза, а ISO 9001 — водительские права, то стандарты эксплуатационных характеристик продукции — это фактические технические характеристики автомобиля: мощность, крутящий момент, расход топлива. Они показывают, на что действительно способен тот или иной компонент, при каких условиях и в течение какого времени.
Для низковольтного распределительного и управляющего оборудования основополагающей нормативной базой является серия стандартов IEC 60947. Стандарт IEC 60947-4-1 посвящён контакторам и пускателям двигателей — он определяет категории использования, такие как AC-3 (обычный пуск двигателя), и устанавливает минимальную электрическую долговечность, которой должен обладать контактор. Контактор, рассчитанный на 1 миллион электрических циклов в режиме AC-3, является полноценным промышленным изделием. Контактор, рассчитанный на 2 миллиона циклов, находится в совершенно другой лиге — он прослужит в два раза дольше в тех же условиях эксплуатации, а разница в цене (обычно 20–40%) окупается до доли цента за один цикл.
В отношении импульсных источников питания безопасность регулируется стандартом IEC 62368-1, однако для дистрибьюторов наиболее важным показателем является КПД. Источник питания с КПД 85% преобразует 15% входящей мощности в тепло. При КПД 92% этот показатель снижается до 8% — почти вдвое меньше тепла. Меньшее количество тепла означает более длительный срок службы электролитических конденсаторов, которые являются основным источником износа в источниках питания. Разница между устройствами с эффективностью 85% и 92% может составить 2–3 года дополнительного срока службы в теплом корпусе, а характеристики пульсаций и шума (≤150 мВp-p против ≤50 мВp-p) показывают, насколько «чистая» выходная мощность для чувствительной последующей электроники.
В отношении датчиков приближения стандарт IEC 60947-5-2 определяет эксплуатационные параметры, включая расстояние срабатывания и точность повторяемости. Стандартный индуктивный датчик приближения с номинальным расстоянием срабатывания 2 мм и точностью повторяемости ±10% подходит для простого обнаружения присутствия. Для прецизионного позиционирования — например, для обнаружения смены инструмента на станке с ЧПУ — точность повторяемости ±2% является обязательным требованием, и разница в цене отражает точность изготовления, необходимую для её достижения.
Эта закономерность наблюдается во всех категориях товаров: всегда существует нижний порог, соответствующий стандарту, и всегда есть верхний предел, значительно превышающий стандарт. Производитель, который может точно указать, где именно в этом диапазоне находится его продукт — с приведением данных испытаний, — именно тот, у кого стоит разместить заказ.
Соответствие экологическим и материальным требованиям: RoHS, REACH и их сфера применения
Директива RoHS (Об ограничении использования опасных веществ, Директива 2011/65/ЕС) ограничивает содержание шести исходных веществ — свинца, ртути, кадмия, шестивалентного хрома, ПББ, и ПБДЭ — содержание каждого из них не должно превышать 0,1% по весу в однородных материалах (кадмий: 0,01%), а также четырех фталатов (ДЭХП, ББП, ДБП, ДИБП) — по 0,1% для каждого. REACH (Регистрация, оценка и разрешение химических веществ, Регламент ЕС 1907/2006) с начала 2026 года охватывает более 240 веществ, вызывающих особое беспокойство (SVHC), при этом список кандидатов обновляется каждые шесть месяцев.
Для дистрибьютора актуальным вопросом является проверка. Самодекларация поставщика о соответствии требованиям RoHS стоит примерно столько же, сколько бумага, на которой она написана. «Золотым стандартом» являются протоколы испытаний, выданные независимой лабораторией, аккредитованной по стандарту ISO 17025, с указанием номера протокола, даты и перечня испытуемых веществ. Скрининг методом рентгеновской флуоресценции (XRF) позволяет быстро проверить наличие элементов, ограниченных директивой RoHS, на отдельных образцах, но не позволяет обнаружить фталаты — для этого требуется анализ методом газовой хроматографии-масс-спектрометрии (GC-MS). Если поставщик предоставляет отчет по XRF и заявляет о полном соответствии требованиям RoHS, включая фталаты, то либо он не понимает разницы, либо надеется, что вы её не понимаете.
Тенденции в отрасли, определяющие развитие производства электрических компонентов
Если в предыдущих разделах было рассказано о том, как изготавливаются и сертифицируются электрические компоненты, то в этом разделе дается ответ на вопрос, который рано или поздно задает себе каждый дистрибьютор: станет ли моя линейка продукции дешевле, устареет ли она или и то, и другое? Четыре тенденции, описанные ниже, — это не отдаленные прогнозы, а реальность, которая уже сейчас влияет на цены, предлагаемые поставщиками, сроки доставки и на то, в каких категориях продукции растет или снижается рентабельность.
| Тенденция | Влияние на производство | Что это означает для вашего сорсинга |
|---|---|---|
| Электрификация и электромобили | IGBT автомобильного класса, MOSFET на основе SiC и высоковольтные реле привлекают инвестиции и способствуют расширению производственных мощностей. По прогнозам, мировой рынок силовых устройств на основе SiC вырастет с ~$2,8 млрд в 2024 году до более чем $11 млрд к 2030 году. Между тем стандартные промышленные контакторы и реле выигрывают от эффекта масштаба производства — увеличение общей мощности означает снижение удельных затрат на компоненты промышленного назначения, выпускаемые на тех же производственных линиях. | Если вы занимаетесь дистрибуцией компонентов для промышленных систем управления, в ближайшие 2–3 года следует ожидать давления на снижение цен на основные типы контакторов и реле, поскольку расширение производственных мощностей, обусловленное ростом рынка электромобилей, приведет к избытку предложения в смежных категориях. Ведите переговоры с учетом этой ситуации. |
| ИИ и расширение центров обработки данных | Центры обработки данных и серверы искусственного интеллекта являются основным фактором, определяющим спрос на высокоэффективные источники питания, прецизионные резисторы для измерения тока и разъемы высокой плотности. Сертификация эффективности 80 PLUS, изначально предназначенная для компьютерных источников питания, стала де-факто стандартом качества и для промышленных источников питания на DIN-рейке, при этом уровень «Titanium» (эффективность 96%+) стал эталоном премиум-класса. | В сфере блоков питания происходит незаметное разделение по критериям качества: для многих покупателей класс энергоэффективности перестает быть просто “приятным дополнением” и становится “обязательным требованием”. Наличие в ассортименте моделей от класса «Бронза» до «Золото» позволит вам охватить как ценочувствительные, так и ориентированные на качество сегменты клиентов. |
| Регионализация цепочки поставок | Неопределенность в области торговой политики и эскалация тарифных мер ускоряют диверсификацию производства, позволяющую избавиться от зависимости от одной страны. Вьетнам, Индия и Мексика становятся вторичными производственными центрами по выпуску электрических компонентов, в частности продукции, предназначенной для рынков Северной Америки и Европы. | Поставщик, имеющий налаженные партнерские отношения в сфере складирования или региональной дистрибуции за пределами Китая, обеспечит вам более короткие сроки поставки и гибкость в вопросах тарифов. При оценке новых поставщиков поинтересуйтесь возможностями логистики с использованием нескольких складов — это становится конкурентным преимуществом быстрее, чем осознают большинство дистрибьюторов. |
| Миниатюризация и интеграция | Компоненты становятся всё меньше, при этом приобретая новые функциональные возможности. Датчики всё чаще оснащаются протоколом IO-Link или другими цифровыми протоколами связи. Блоки питания обеспечивают большую мощность при меньших габаритах для монтажа на DIN-рейку. Реле оснащаются контактами для диагностической обратной связи. | Меньшие габариты при тех же технических характеристиках, как правило, свидетельствуют о более совершенном поколении технологического процесса, что, как правило, сопряжено с более высоким общим качеством. Не стоит сравнивать компоненты, ориентируясь исключительно на цену и технические характеристики; форм-фактор может быть скрытым индикатором качества. |
Общая черта всех четырёх тенденций — высочайший уровень производства (стабильное качество, надёжные поставки и возможность выпуска продукции в различных категориях) — становится всё более ценной, а не наоборот. Успеха добьются не самые дешёвые заводы, а те, которые максимально облегчают жизнь своим дистрибьюторам.
Как оценить производителей электрокомпонентов: практический контрольный список для покупателя
Всё, о чём шла речь в предыдущих разделах — производственные процессы, стандарты качества, тенденции в отрасли — подводит к одному практическому вопросу: когда торговый представитель производителя присылает вам коммерческое предложение и брошюру, как отличить суть от рекламных уловок?
Самая распространённая ошибка при оценке поставщиков заключается в том, что решение сводится исключительно к цене и сертификатам. Таблица с тремя столбцами — “Цена за единицу”, “Есть ли сертификат CE?”, “Есть ли сертификат ISO?” — не является оценкой. Это азартная игра. Надёжная оценка охватывает пять аспектов. В совокупности они составляют “проверку состояния” поставщика, которую можно провести, не вставая со своего рабочего места и не будучи инженером.
Производственные возможности: не только перечень оборудования
Списки оборудования — это то, что фабрикам легче всего приукрасить. Да, у них есть машины для поверхностного монтажа. Каждая фабрика утверждает, что у неё есть такие машины. Но настоящий вопрос заключается в следующем: какого поколения они, насколько хорошо обслуживаются и насколько полно используются?
Машина для монтажа поверхностных компонентов (SMT) среднего класса обеспечивает производительность 30 000–50 000 компонентов в час (CPH) с точностью размещения около ±50 мкм. Высокоскоростная линия текущего поколения работает со скоростью 80 000–150 000 CPH при точности ±25 мкм. Если на фотографиях оборудования завода видны машины с облупившейся краской и ЭЛТ-мониторами, то год выпуска модели говорит о философии компании в отношении капиталовложений.
Более показательным, чем само оборудование, является общий коэффициент эффективности оборудования (OEE) — комплексный показатель, объединяющий эксплуатационную готовность, производительность и качество. Эталонный показатель OEE мирового уровня составляет 85%+. Типичный завод работает в диапазоне 60–75%. Показатель ниже 60% свидетельствует о серьёзных проблемах в управлении производством. А коэффициент загрузки мощностей — фактический объём производства, деленный на теоретический максимум — показывает совсем другую картину: значение выше 90% означает, что завод работает на пределе возможностей и ваш заказ попадёт в очередь; значение ниже 50% означает, что у предприятия есть избыточные мощности по сравнению с объёмом заказов от клиентов, что может объяснять их агрессивную ценовую политику, но вызывает вопросы относительно долгосрочной жизнеспособности предприятия.
Три вопроса, которые стоит задать: “Можете ли вы прислать короткое видео с обзором производственной линии, на которой будет изготавливаться наша продукция?” “Когда в последний раз проводилась калибровка вашего оборудования для поверхностного монтажа (SMT) и испытательного оборудования?” “Каков ваш текущий коэффициент загрузки производственных мощностей — и как быстро вы сможете удвоить объём производства нашей продукции в случае резкого роста спроса?”
Проверка соответствия системы качества реальности
Сертификат на стене свидетельствует о том, что аудитор побывал здесь однажды. А действующая система качества доказывает свою эффективность каждый день. Разница заметна, если знать, на что обратить внимание.
Начните с контроля качества поступающей продукции. Попросите показать образец отчета по контролю качества поступающей продукции — не пустой шаблон, а реальный заполненный отчет по недавней поставке материалов. В реальном отчете должны быть указаны измеренные значения в сравнении с предельными значениями, результат проверки («прошел/не прошел») и отслеживаемый номер партии. Пустой шаблон без данных — это тревожный сигнал, свидетельствующий о том, что контроль качества поступающей продукции существует лишь на бумаге.
Переходим к контролю процессов. «Золотым стандартом» является статистический контроль процессов (SPC) с использованием контрольных карт в режиме реального времени. Ключевые характеристики процесса — объем нанесения паяльной пасты, усилие обжима при соединении клемм, сопротивление катушки реле — должны контролироваться с помощью карт X-bar R или аналогичных инструментов, а полученные значения Cpk должны фиксироваться в документации. Значение Cpk ≥1,33 по критическим характеристикам означает, что процесс способен удерживаться в пределах технических требований при нормальных колебаниях. Завод, который не может предоставить данные по Cpk, по сути признает, что не измеряет способность процесса.
Завершает картину контроль качества на выходе. Стандарт отбора проб “Допустимый уровень качества” (AQL) — как правило, «Общий уровень проверки II» — определяет, сколько единиц продукции подлежит проверке и какой уровень дефектов приводит к браку. Для электрических компонентов в случае критических дефектов (влияющих на безопасность) следует использовать AQL 0,65 или более строгий уровень, для серьезных дефектов (влияющих на функциональность) — AQL 1,0, а для незначительных дефектов (косметических) — AQL 2,5. Спросите: «Какой уровень AQL вы применяете для критических и серьезных дефектов при окончательном контроле?»
И тест на прослеживаемость: “Если я назову вам номер партии продукта, который получил шесть месяцев назад, сможете ли вы сказать, какие партии сырья использовались при его производстве и какие операторы работали на каждом участке?” На этом вопросе завод с высоким уровнем качества сможет ответить утвердительно менее чем за час.
Стабильность цепочки поставок и послужной список по доставке
Для дистрибьютора отличный товар, который поступает с двухмесячным опозданием, хуже, чем товар среднего качества, поступивший вовремя. Ваш клиент ждет. На карту поставлена ваша репутация.
Показатель “Своевременность и полнота поставки” (OTIF) является ключевым показателем — он оценивает как своевременность доставки заказа к обещанной дате, так и полноту поставки. Поставщик, заявляющий о “своевременности поставок на уровне 98%”, но учитывающий в качестве «своевременной» только «частичную отгрузку», скрывает реальный показатель OTIF, который может быть на 20 пунктов ниже. Запросите данные о фактических отгрузках за последние шесть месяцев — даты, заказанные и отгруженные количества — и рассчитайте показатель OTIF самостоятельно.
Устойчивость цепочки поставок — это перспективный аспект. Если единственный поставщик критически важных микроконтроллеров для вашего завода прекратит работу на восемь недель — что станет с вашими заказами? Устойчивый производитель обеспечивает как минимум наличие двух проверенных поставщиков для компонентов, связанных с риском зависимости от единственного поставщика, и поддерживает страховой запас материалов с длительным сроком поставки на 4 и более недель. Задайте вопрос напрямую: “Какова степень вашего риска, связанного с единственным поставщиком компонентов для нашего продукта, и какова ваша стратегия снижения этого риска?”
Прозрачность коммуникации — это тот самый “мультипликатор”. Когда возникает задержка, уведомляет ли поставщик вас проактивно, сообщая обновленную дату поставки и причину задержки, или же он молчит, пока вы не начнете его преследовать? Есть ли у вас единый контактный человек, ответственный за ваше счёт — и если этот человек уйдёт, знает ли кто-нибудь ещё историю ваших заказов? Эти «нематериальные» факторы влекут за собой более серьёзные финансовые последствия, чем признают большинство покупателей.
Структура затрат и прозрачность ценообразования
Цена за единицу в коммерческом предложении — это только начало обсуждения затрат, а не его конец. Для дистрибьютора важным показателем является совокупная стоимость владения (TCO): цена за единицу плюс затраты на входящую логистику, таможенные пошлины, затраты на входной контроль качества, а также ожидаемые затраты, связанные с нарушениями качества, распределенные по всему объему заказа.
Простой пример поможет наглядно это проиллюстрировать. Предположим, вы сравниваете двух поставщиков компонента, который закупаете в количестве 10 000 единиц в год. Поставщик А предлагает цену $4,50 за единицу при историческом показателе брака 1%. Поставщик Б предлагает цену $4,30 за единицу при историческом показателе брака 3%. На первый взгляд поставщик B позволяет вам сэкономить $2 000 в год. Однако 3% брака на 10 000 единиц означает, что 300 единиц окажутся бракованными — а каждый брак обходится вам не только в стоимость самого компонента, но и в расходы на доставку, таможенное оформление, взаимодействие с клиентами и логистику замены. По консервативной оценке, общие затраты на устранение одного отказа составляют $15: 300 × $15 = $4,500 затрат на обеспечение качества. “Более выгодное” предложение поставщика B на самом деле обходится вашему бизнесу на $2,500 больше в год.
Минимальный объем заказа (MOQ) — ещё один скрытый фактор, влияющий на затраты. Если MOQ равен трём месяцам вашего типичного объёма продаж, это означает, что оборачиваемость запасов составляет четыре раза в год, что приводит к замораживанию оборотного капитала и занимает складские площади. Если MOQ равен одному месяцу продаж, это означает двенадцать оборотов запасов, что освобождает денежные средства для других товаров. Разница в MOQ между двумя поставщиками с точки зрения реального влияния на бизнес может легко перевесить разницу в цене за единицу 5%.
Условия оплаты — это третье измерение. Аванс в размере 30% по системе T/T с оплатой 70% до отгрузки по сравнению с авансом в размере 30% с оплатой 70% после предоставления копии документов по сравнению с аккредитивом на 60 дней — каждое из этих условий по-разному влияет на потребности в оборотном капитале. Для дистрибьютора, работающего с валовой рентабельностью 15–25%, 60-дневный промежуток между оплатой поставщику и получением оплаты от клиента может существенно осложнить денежный поток. При сравнении учитывайте условия оплаты наряду с ценой за единицу.
Коммуникация, обслуживание и мультипликативный эффект
Поставщик, который в течение 24 часов отвечает на запрос предложений, предоставив полное коммерческое предложение, технические паспорта на понятном английском языке и задав несколько уточняющих вопросов о вашей сфере применения, — в отличие от того, кто отвечает через пять дней, указав цену всего в одной строке, — не просто удобнее в работе. С ним работать выгоднее. Каждый час, который вы тратите на получение разъяснений, перевод документации или объяснение базовых технических характеристик поставщику, — это час, который вы не тратите на продажи своим собственным клиентам.
Именно здесь структура вашей базы поставщиков становится стратегическим вопросом. Типичный небольшой дистрибьютор закупает товары у 10–20 различных заводов, у каждого из которых есть свой канал связи, процесс контроля качества, логистическая схема и условия оплаты. Административные издержки, связанные с управлением таким количеством отношений с поставщиками — по самым скромным оценкам, $200–500 в месяц на каждого поставщика, включая время на координацию, обработку документов и контроль качества — составляют тысячи долларов скрытых затрат ежемесячно. Консолидация закупок у меньшего числа поставщиков с более широким ассортиментом напрямую сокращает эти затраты. Производитель, предлагающий более 30 категорий продукции под одной крышей, кардинально меняет ситуацию: нагрузка дистрибьютора по управлению поставщиками снижается с управления дюжиной отношений до управления двумя или тремя, что освобождает время и внимание для деятельности, приносящей доход.
Оценивая нового поставщика, задайте себе вопрос: упрощает ли сотрудничество с этой компанией работу моего бизнеса или, наоборот, усложняет её? Ответ на этот вопрос, применённый ко всем поставщикам в вашем списке, может стать главным фактором, определяющим вашу операционную рентабельность.
Если вы проводите оценку поставщиков и хотите сравнить ассортимент и технические характеристики другого производителя, каталог продукции OMCH доступен по адресу www.omch.com.
Ссылки
-
IEC. “IEC 61760-1:2026 — Технология поверхностного монтажа”. 2026.
https://www.une.org/encuentra-tu-norma/busca-tu-norma/iec/?c=116912 -
IPC. “IPC-A-610 — Приемлемость электронных сборок”.”
https://shop.ipc.org/standards/standard-only -
МЭК. “Серия МЭК 60947 — Низковольтное распределительное и управляющее оборудование”.”
https://www.iec.ch/ -
Европейская комиссия. “Директива RoHS 2.0 2011/65/EU”.”
https://ec.europa.eu/environment/topics/waste-and-recycling/rohs-directive_en -
Европейское химическое агентство (ECHA). “Список кандидатов в SVHC по REACH”.”
https://echa.europa.eu/candidate-list-table -
Research and Markets. “Отчёт о рынке электрических и электронных компонентов 2026”. 2026 г.
https://www.researchandmarkets.com/reports/5792767/electrical-electronics-components-market-report -
Блог “Пассивные компоненты”. «Проблемы качества и снижение рисков для пассивных компонентов в суровых условиях эксплуатации».”
https://passive-components.eu/quality-challenges-and-risk-mitigation-for-passive-components-in-harsh-environments/

 English
  Arabic
  Turkish
  Russian
  Spanish
  French
  Indonesian
  Portuguese
  Thai
Thai  Vietnamese