


Seberapa Besar Pasar Komponen Listrik Industri?
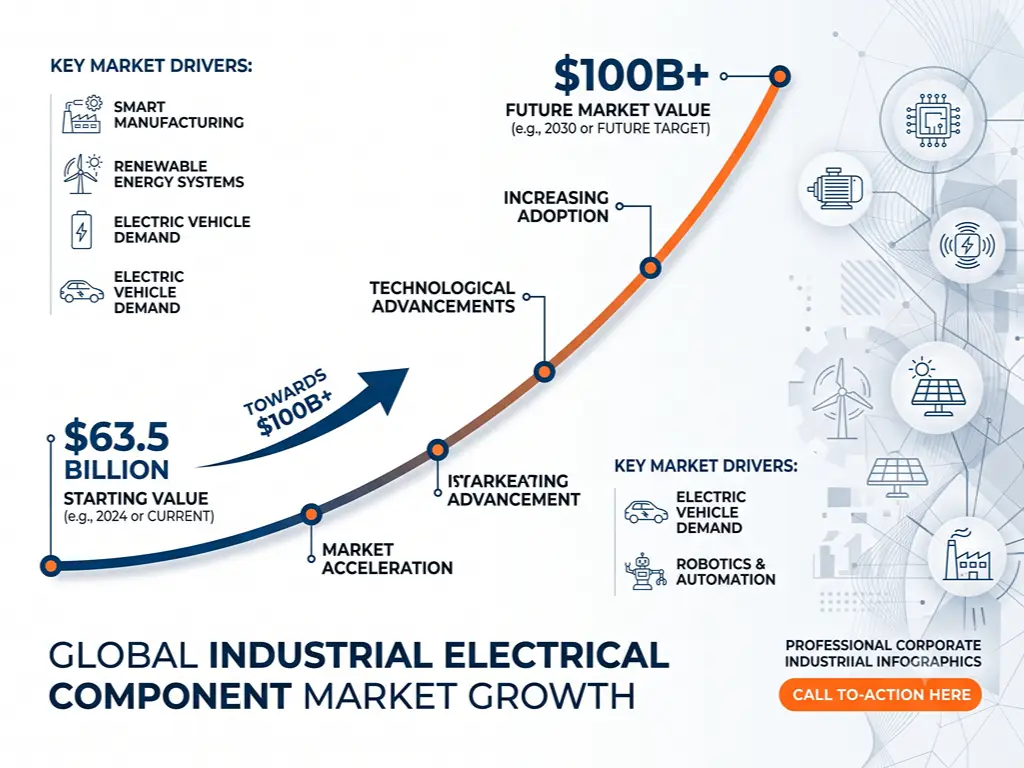
Jika Anda pernah mencari data mengenai pasar ini, Anda mungkin pernah menemukan tiga angka yang berbeda dan bertanya-tanya mana yang bisa dipercaya. Pasar komponen listrik industri diperkirakan bernilai sekitar $63,5 miliar pada tahun 2025, menurut Fortune Business Insights. Mordor Intelligence memperkirakan nilainya sebesar $57,2 miliar, sedangkan 6Wresearch memperkirakan angka yang lebih rendah, yaitu $8,4 miliar untuk tahun 2024. Ketiganya benar. Perbedaan ini disebabkan oleh cakupan analisis: laporan yang lebih luas mencakup segala hal mulai dari kabel dan peralatan sakelar hingga unit distribusi daya dan papan sakelar, sedangkan laporan yang lebih sempit hanya berfokus pada kategori komponen tertentu.
Berapa pun angka yang Anda jadikan acuan, arahnya sudah jelas. Pasar ini tumbuh dengan tingkat pertumbuhan tahunan majemuk antara 9,6% dan 11%, sehingga diperkirakan akan mencapai angka antara $90 miliar dan $162 miliar pada awal tahun 2030-an (Fortune Business Insights, 2025).
Tiga faktor yang mendorong pertumbuhan tersebut.
Pertama, otomatisasi industri. Pabrik-pabrik di seluruh dunia sedang memperluas lini produksi berbasis robot, motor pintar, dan mesin yang dikendalikan secara digital. Setiap instalasi tersebut memerlukan pemasangan kabel, pengaliran arus melalui panel distribusi, dan transformasi tegangan di setiap titik sambungan. Sektor industri kini menyumbang sekitar 40% dari konsumsi energi akhir global, dan pangsa listrik dalam komposisi tersebut meningkat sekitar setengah poin persentase setiap tahun seiring dengan penggantian proses yang menggunakan bahan bakar fosil oleh elektrifikasi (IEA, 2025).
Kedua, modernisasi jaringan listrik. Infrastruktur yang semakin tua di Amerika Utara dan Eropa, ditambah dengan perluasan besar-besaran energi terbarukan melalui pembangkit listrik tenaga surya, proyek pembangkit listrik tenaga angin, fasilitas penyimpanan baterai, dan jaringan pengisian daya kendaraan listrik, telah menciptakan permintaan yang berkelanjutan terhadap trafo, peralatan pengatur arus, dan peralatan distribusi listrik cerdas.
Ketiga, industrialisasi di negara-negara berkembang. Produksi manufaktur Tiongkok tumbuh 6,5% secara tahunan pada bulan April 2023 saja, sementara produksi baja mentah India melampaui 103 juta metrik ton dalam sepuluh bulan pertama tahun fiskal 2022. Setiap pabrik dan kawasan industri baru di pasar-pasar ini merupakan lokasi pemasangan baru bagi komponen-komponen listrik.
Intinya begini: ini bukanlah sektor khusus. Ini adalah tulang punggung kelistrikan industri global, yang tumbuh lebih cepat daripada perekonomian secara umum. Namun, “pasar” ini tidak bersifat tunggal. Pasar ini terfragmentasi berdasarkan produk, pembeli, dan tingkatan tegangan, yang sangat berpengaruh bagi siapa pun yang melakukan pengadaan atau penjualan di dalamnya.
Segmentasi Pasar — Produk, Pengguna Akhir, dan Tingkat Tegangan
Tiga aspek menentukan posisi setiap komponen listrik di pasar ini: apa itu komponen tersebut, siapa yang membelinya, dan pada tingkat tegangan berapa komponen tersebut beroperasi. Memahami ketiga aspek tersebut adalah perbedaan antara sekadar mengetahui bahwa pasar itu ada dan mengetahui di mana letak peluang Anda di dalamnya.
Berdasarkan Jenis Produk — Kabel, Peralatan Pengatur Arus, Trafo, dan Lainnya
Kabel dan kawat merupakan kategori tunggal terbesar, yang secara keseluruhan menguasai sekitar 42% pangsa pasar berdasarkan pendapatan. Kabel sendiri menyumbang 24%, sedangkan kawat menyumbang 18% (Fortune Business Insights, 2025). Namun, yang terbesar belum tentu yang paling menarik. Kabel merupakan komoditas dengan volume tinggi dan margin rendah; margin yang sesungguhnya justru terletak pada tahap yang lebih tinggi dalam rantai nilai.
| Jenis Produk | Pangsa Pasar | Aplikasi Khas | Profil Pembeli Utama |
|---|---|---|---|
| Kabel | 24% | Transmisi tenaga listrik, instalasi listrik bangunan, mesin industri | Kontraktor listrik, distributor |
| Kabel | 18% | Kabel kontrol, kabel motor, instrumen | Pembuat panel, produsen peralatan asli (OEM) |
| Peralatan Pemutus Arus | 17% | Distribusi daya, perlindungan sirkuit, pengendalian motor | Pabrik industri, perusahaan utilitas, kontraktor EPC |
| Transformers | 14% | Peningkatan/penurunan tegangan, interkoneksi jaringan, tenaga listrik industri | Perusahaan utilitas, fasilitas industri berskala besar |
| Unit Distribusi Listrik | 11% | Pusat data, sistem distribusi di lantai pabrik, rak server | Operator pusat data, manajer pabrik |
| Switchboards | 10% | Saluran masuk listrik gedung, sistem distribusi fasilitas industri | Kontraktor listrik, manajer fasilitas |
| Komponen lain (relay, konektor, sekring) | 6% | Panel kontrol, rangkaian pelindung | Pembuat panel, tim pemeliharaan |
Peralatan sakelar dan transformator, meski volumenya lebih kecil, memiliki hambatan teknis yang lebih tinggi untuk masuk ke pasar serta margin keuntungan yang jauh lebih baik. Pemutus arus tegangan rendah merupakan barang komoditas. Pemutus arus vakum tegangan menengah memerlukan sertifikasi uji tipe sesuai standar IEC 62271 — investasi bernilai enam digit yang berfungsi sebagai benteng pertahanan alami. Transformator daya harus mematuhi standar IEC 60076, dengan protokol pengujian yang dapat memakan waktu berbulan-bulan.
Bayangkan pasar seperti sebuah supermarket. Kabel dan kawat adalah bagian produk segar: perputaran barang cepat, margin tipis, dan semua orang membutuhkannya. Peralatan sakelar adalah konter makanan khusus: frekuensi pembelian lebih rendah, harga lebih tinggi, dan pelanggan yang tahu persis spesifikasi apa yang mereka butuhkan. Trafo adalah bagian peralatan rumah tangga: pembelian jarang dilakukan dengan siklus pengambilan keputusan yang sangat lama.
Berdasarkan Sektor Pengguna Akhir — Siapa Sebenarnya yang Membeli?
Sektor manufaktur mendominasi permintaan, dengan menyerap 34% dari seluruh komponen listrik industri. Sektor konstruksi menyusul dengan 21%, kemudian minyak dan gas dengan 14%, kimia dan petrokimia dengan 12%, serta pertambangan dengan 9% (Fortune Business Insights, 2025).
| Sektor Pengguna Akhir | Pangsa Pasar | Pembelian Utama | Pola Pembelian |
|---|---|---|---|
| Manufaktur | 34% | Peralatan pengatur daya, pengendali motor, kabel, PDU, sensor | Pesanan berulang, pengisian stok triwulanan |
| Konstruksi | 21% | Kabel, papan sakelar, panel distribusi, perangkat kabel | Berbasis proyek, sensitif terhadap harga |
| Minyak & Gas | 14% | Peralatan tahan ledakan, panel sakelar tegangan tinggi, kabel khusus | Siklus pengadaan yang panjang, dengan persyaratan sertifikasi yang ketat |
| Kimia & Petrokimia | 12% | Kotak pelindung tahan korosi, pengendalian proses, instrumentasi | Berorientasi pada kepatuhan, terikat pada spesifikasi |
| Pertambangan | 9% | Peralatan sakelar tahan guncangan, kabel penghubung, starter motor | Lingkungan yang keras, keandalan yang sangat penting |
Pembeli di sektor manufaktur dan konstruksi pada dasarnya sangat berbeda. Seorang manajer pemeliharaan pabrik melakukan pemesanan berulang dengan frekuensi yang dapat diprediksi dan lebih mengutamakan keandalan pasokan daripada harga. Sebaliknya, seorang manajer proyek konstruksi hanya melakukan pembelian sekali per proyek dan berada di bawah tekanan biaya yang sangat tinggi. Bagi distributor yang ingin membangun portofolio bisnis yang berkelanjutan, segmen manufaktur merupakan pilihan yang lebih menguntungkan dalam jangka panjang: permintaan yang berulang, biaya peralihan yang lebih tinggi, serta hubungan bisnis yang semakin menguat seiring berjalannya waktu.
Berdasarkan Jenis Tegangan — Pasar Tegangan Rendah, Menengah, dan Tinggi
Tingkat tegangan merupakan indikator terbaik untuk mengukur tingkat persaingan di pasar ini.
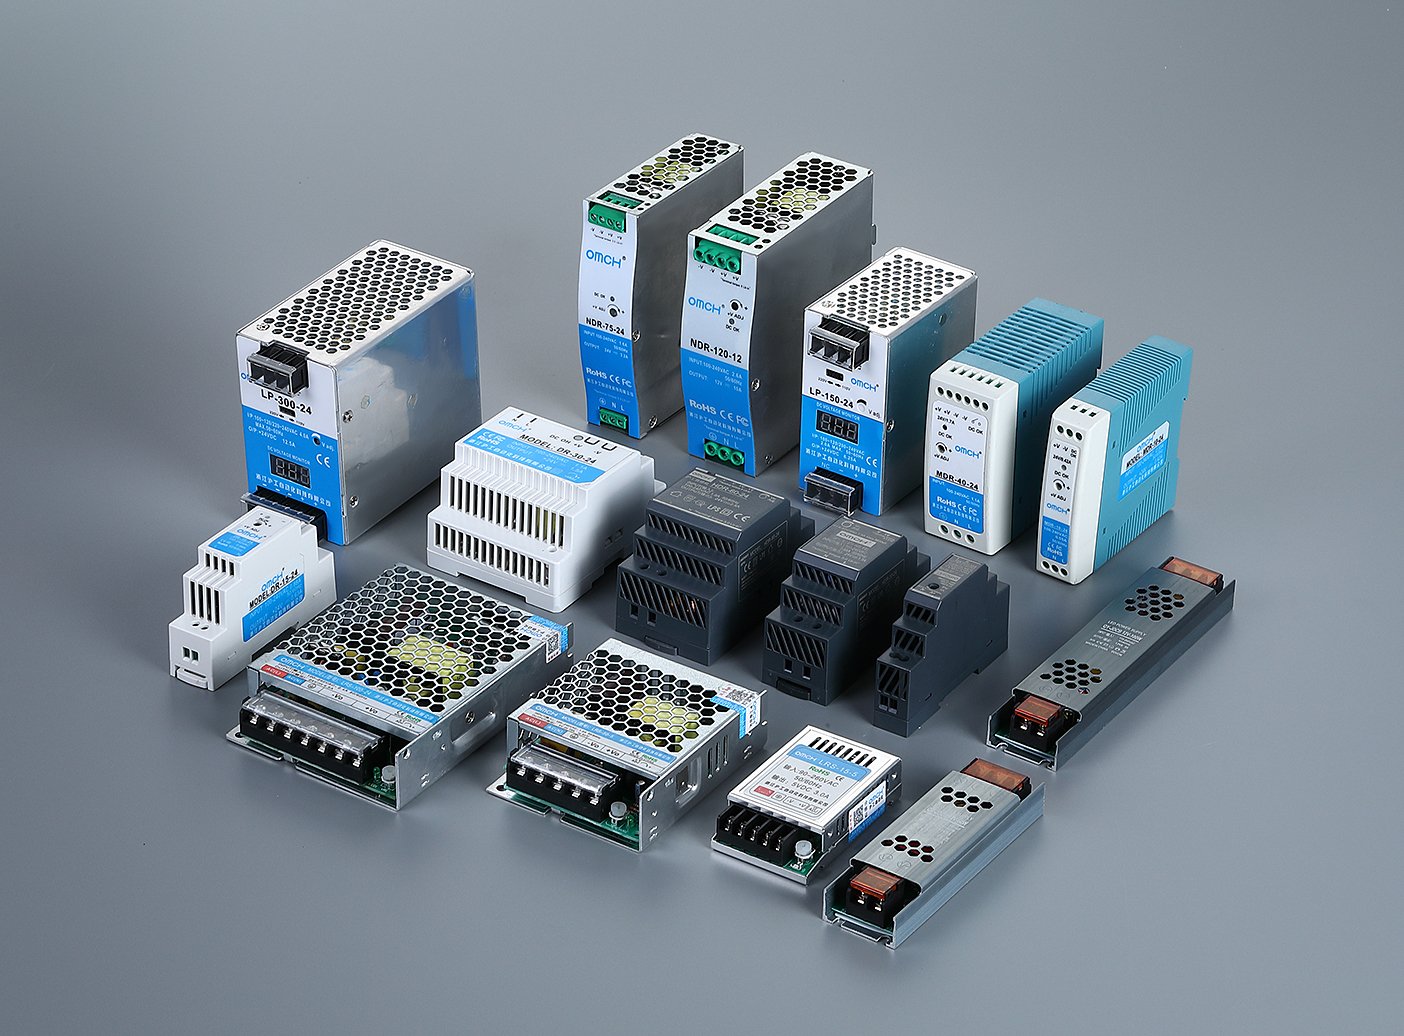
Tegangan rendah (≤1 kV) merupakan segmen terbesar dan paling mudah diakses. Produk-produk seperti pemutus arus miniatur, kontaktor, dan catu daya rel DIN diperdagangkan dalam volume besar dengan tingkat diferensiasi yang relatif rendah. Inilah semacam “toko serba ada” di dunia kelistrikan: mudah dimasuki, sangat kompetitif, dengan margin keuntungan yang lebih mengutamakan efisiensi operasional daripada keunikan teknis.
Tegangan menengah (1 kV–36 kV) Di sinilah segalanya berubah. Pemutus arus vakum, unit sirkuit cincin, dan perlengkapan sakelar tegangan menengah memerlukan sertifikasi uji tipe serta investasi modal yang besar. Pembeli di sektor ini — perusahaan utilitas, pabrik industri besar, dan perusahaan pertambangan — menentukan produk berdasarkan kepatuhan teknis, bukan harga. Begitu sebuah pemasok memenuhi syarat dalam suatu spesifikasi, biaya peralihan menjadi sangat tinggi.
Tegangan tinggi (>36 kV) merupakan industri yang sama sekali berbeda. Peralatan sakelar berisolasi gas, trafo daya dengan kapasitas terukur dalam MVA, dan peralatan kelas transmisi didominasi oleh segelintir pemain global. Hambatan teknis, persyaratan sertifikasi, dan intensitas modal membuat segmen ini sulit dijangkau oleh sebagian besar pelaku usaha kelas menengah.
Bagi distributor atau manajer pengadaan pada umumnya, tegangan rendah adalah bidang utama, tegangan menengah adalah jalur pengembangan, sedangkan tegangan tinggi hanyalah tontonan belaka.
Lanskap Regional — Di Mana Pertumbuhan Terjadi (dan Di Mana Pabrik-pabrik Berada)
Asia-Pasifik mendominasi konsumsi sebesar 36% di pasar global, yang terutama didorong oleh ekspansi industri di Tiongkok dan India. Amerika Utara menyusul dengan 27%, didorong oleh pemindahan kembali industri manufaktur ke dalam negeri, pembangunan pusat data, dan modernisasi jaringan listrik. Eropa mencatat 24%, dengan Jerman sendiri menyumbang 8% dari pasar Eropa (Fortune Business Insights, 2025).
Namun, terdapat ketidakseimbangan yang krusial dalam angka-angka ini yang jarang diakui dalam laporan pasar: Tempat komponen-komponen tersebut digunakan bukanlah tempat di mana komponen-komponen tersebut diproduksi. Asia-Pasifik merupakan konsumen terbesar sekaligus basis produksi yang dominan. Amerika Utara, sebagai konsumen terbesar kedua, mengimpor sebagian besar komponen listrik industrinya. Eropa menempati posisi tengah: unggul dalam manufaktur kelas atas seperti peralatan sakelar asal Jerman dan Swiss serta komponen otomatisasi asal Italia, namun semakin bergantung pada pasokan dari Asia untuk produk-produk tegangan standar.
Ketidakseimbangan geografis antara konsumsi dan produksi ini bukanlah suatu kelemahan. Justru hal itulah yang menjadi landasan struktural perdagangan komponen listrik. Jika Anda adalah distributor di Amerika Utara, Eropa, Asia Tenggara, Timur Tengah, atau Afrika, rantai pasokan Anda hampir pasti dapat ditelusuri kembali ke klaster manufaktur yang terkonsentrasi di beberapa wilayah tertentu. Memahami klaster-klaster tersebut — bidang spesialisasi mereka, cara penetapan harga, dan kebijakan perdagangan apa yang memengaruhi mereka — jauh lebih penting daripada statistik ukuran pasar apa pun. Hal itulah yang akan dibahas dalam dua bagian berikutnya.
Pemain Utama — Siapa yang Menguasai Pasar Komponen Listrik Industri?
Pasar komponen listrik industri secara struktural terfragmentasi. Siemens menguasai sekitar 13% pangsa pasar global, sedangkan Schneider Electric sekitar 12%. Kedua pemain terbesar tersebut secara gabungan hanya menguasai kurang dari seperempat pasar (Fortune Business Insights, 2025). Sisanya, yaitu sekitar 75%, tersebar di antara puluhan spesialis regional, produsen kelas menengah, dan pemain yang berfokus pada kategori tertentu.
| Perusahaan | Kantor Pusat | Perkiraan Pangsa Pasar | Kekuatan Utama |
|---|---|---|---|
| Siemens AG | Jerman | ~13% | Rangkaian lengkap: otomatisasi, panel sakelar tegangan rendah/menengah, penggerak, sistem kendali |
| Schneider Electric | Prancis | ~12% | Distribusi LV, otomatisasi gedung, manajemen energi |
| ABB Ltd. | Swiss | - | Peralatan tegangan menengah/tinggi, robotika, sistem penggerak, solusi jaringan listrik |
| Eaton Corporation | Irlandia/AS | - | Distribusi tenaga listrik, kualitas tenaga listrik, sistem pengendalian pencahayaan |
| Mitsubishi Electric | Jepang | - | Otomatisasi pabrik, panel sakelar tegangan rendah/menengah, sistem pengendalian HVAC |
| General Electric | AS | - | Solusi jaringan, peralatan tegangan tinggi, sistem kontrol industri |
| Otomasi Rockwell | AS | - | Otomasi pabrik, pengendalian motor, jaringan industri |
| Emerson Electric | AS | - | Pengendalian proses, otomatisasi sistem fluida, solusi industri |
Daftar 10 besar ini, bagaimanapun, sebagian besar tidak relevan dengan realitas sehari-hari sebagian besar distributor dan manajer pengadaan. Siemens dan Schneider mendominasi proyek-proyek yang didasarkan pada spesifikasi — jenis proyek di mana konsultan teknik menyebutkan merek tertentu dalam dokumen tender. Namun, sebagian besar transaksi komponen listrik industri terjadi di luar lingkup tersebut, dalam ekosistem paralel yang terdiri dari produsen regional, eksportir spesialis, dan pemasok multi-kategori yang namanya tak pernah muncul dalam laporan riset pasar.
Bayangkan saja seperti industri otomotif. Siemens, Schneider, dan ABB adalah seperti Mercedes, BMW, dan Audi: merek yang dikenal luas, spesifikasinya mendominasi pasar, dan harganya premium. Bagi sebagian besar pembeli, pilihan praktis terletak pada puluhan “Toyota” dan “Honda” di dunia kelistrikan — produsen yang menawarkan kepatuhan setara dengan harga yang lebih kompetitif, seringkali dengan fleksibilitas yang lebih besar dalam hal volume pesanan dan penyesuaian. Mengetahui cara mengidentifikasi dan menilai pemasok-pemasok ini merupakan keterampilan inti dalam pengadaan, dan hal ini menjadi topik pada bagian terakhir di bawah ini.
Tren yang Mengubah Wajah Pasar — Cerdas, Ramah Lingkungan, dan Terstruktur Ulang
Tiga pergeseran struktural sedang mengubah hal-hal yang perlu ditentukan oleh pembeli serta tempat-tempat yang perlu mereka telusuri. Dua yang pertama memengaruhi produk itu sendiri; sedangkan yang ketiga mengubah peta pasokan.
Komponen Cerdas dan Industri 4.0 — Apa Saja Perubahan pada Lembar Spesifikasi
Sepuluh tahun yang lalu, membeli pemutus arus berarti memeriksa tiga angka: arus pengenal, kapasitas pemutusan, dan jumlah kutub. Saat ini, kategori produk yang sama mencakup perangkat yang dilengkapi sensor arus terintegrasi, modul komunikasi, dan kemampuan diagnostik jarak jauh. Spesifikasi pengadaan pun telah diperluas sesuai dengan hal tersebut.
Dampak praktisnya bagi pembeli dapat dikelompokkan ke dalam tiga bidang:
Kecerdasan tertanam. Platform panel listrik cerdas yang diluncurkan oleh pemasok besar pada tahun 2024 kini dilengkapi dengan fitur diagnostik pemeliharaan prediktif yang memantau keausan kontak, tren suhu, dan riwayat pemutusan secara real-time. Bagi tim pengadaan, hal ini berarti perlu menambahkan kompatibilitas protokol komunikasi — IO-Link, Ethernet/IP, PROFINET — ke dalam daftar periksa spesifikasi standar.
Semikonduktor celah pita lebar. Peralihan dari silikon ke silikon karbida (SiC) dan gallium nitrida (GaN) dalam bidang elektronika daya memicu munculnya permintaan di hilir terhadap kategori baru komponen pasif. Samsung Electro-Mechanics telah meloloskan uji kualifikasi untuk MLCC kelas otomotif/industri bertegangan 1.000 V pada tahun 2025, sehingga memperluas penggunaan kapasitor keramik ke dalam rangkaian inverter yang sebelumnya didominasi oleh kapasitor film (TTI MarketEYE, 2026). Inti magnetik nanokristalin dan amorf, yang diperlukan untuk frekuensi peralihan yang lebih tinggi yang dimungkinkan oleh semikonduktor ini, kini menjadi kategori pasokan strategis di mana ketersediaannya semakin menipis.
Sistem modular dan siap pakai. Rakitan kabel prefabrikasi, panel listrik yang dapat disesuaikan, dan konfigurasi PDU modular mempercepat proses pemasangan di lantai pabrik dan pusat data. Bagi pembeli, hal ini berarti peralihan dari pengadaan di tingkat komponen ke tingkat subsistem, serta peningkatan nilai yang sejalan bagi pemasok yang mampu menyediakan solusi terintegrasi daripada suku cadang yang dijual secara terpisah.
Hal ini tidak berarti bahwa komponen-komponen standar yang ada saat ini menjadi usang. Namun, kesenjangan spesifikasi antara yang “dasar” dan yang “cerdas” semakin melebar. Distributor yang tidak mampu membantu pelanggan mereka mengatasi kesenjangan tersebut akan mengalami penurunan nilai.
Ketentuan Efisiensi Energi dan Keberlanjutan — Daftar Periksa Kepatuhan Terbaru
Bagi para distributor yang memasarkan produknya ke pasar Eropa, kepatuhan terhadap peraturan telah berubah dari sekadar “hal yang baik untuk dimiliki” menjadi “persyaratan untuk mengakses pasar.”
Mekanisme Penyesuaian Batas Karbon (CBAM) Uni Eropa memasuki fase definitifnya pada 1 Januari 2026. Meskipun cakupannya saat ini mencakup bahan baku — baja, aluminium, semen, pupuk, listrik, dan hidrogen — Komisi Eropa mengusulkan pada Desember 2025 untuk memperluas CBAM ke sekitar 180 produk hilir yang mengandung baja dan aluminium dalam jumlah signifikan. Trafo daya, peralatan sakelar, motor, dan generator diperkirakan akan dimasukkan pada tahun 2028 (CIGRE, 2026).
Ketika CBAM diterapkan pada peralatan listrik, dampaknya terhadap biaya akan sangat signifikan. Harga karbon di Uni Eropa saat ini diperdagangkan sekitar €75 per ton CO₂, dan nilai emisi default yang diterapkan pada bahan baku dari negara-negara tertentu dapat meningkatkan jejak karbon yang dihitung sebesar 1,6 hingga 6 kali lipat dibandingkan emisi aktual. Untuk trafo listrik berkapasitas 100 MVA yang umum, yang mengandung beberapa ton baja dan tembaga, kewajiban tambahan akibat CBAM dapat mencapai puluhan ribu euro.
Sebuah peraturan serupa, yaitu Peraturan F-Gas Uni Eropa (2024/573), secara bertahap menghentikan penggunaan sulfur heksafluorida (SF₆) pada peralatan sakelar tegangan menengah. SF₆ merupakan media isolasi standar industri untuk peralatan pengatur tegangan berisolasi gas, namun memiliki potensi pemanasan global 23.500 kali lipat dibandingkan CO₂. Peraturan ini mendorong pembeli untuk beralih ke alternatif bebas SF₆, sehingga menciptakan kriteria spesifikasi baru yang belum dimasukkan dalam sebagian besar kerangka kerja pengadaan.
Mencari Komponen Listrik Industri — Panduan Praktis bagi Pembeli
Di sinilah laporan pasar berakhir dan pekerjaan sesungguhnya dimulai. Mengetahui bahwa nilai pasar sebesar $63 miliar dan tumbuh sebesar 10% merupakan konteks yang berguna. Mengetahui di mana sebenarnya lokasi pabrik-pabrik tersebut, bidang apa yang menjadi spesialisasinya, dan bagaimana kebijakan perdagangan mengubah perhitungan biaya — itulah yang memengaruhi hasil proses pengadaan.
Di Mana Letak Pabrik-Pabrik Itu — Peta Sumber Pasokan Regional
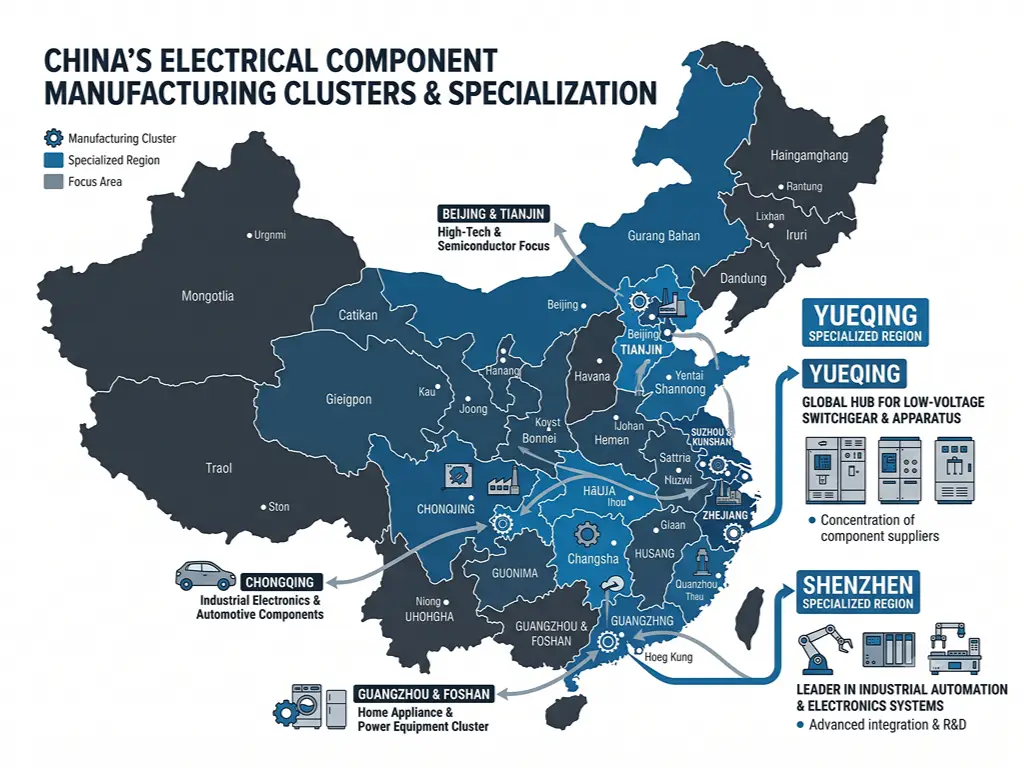
Industri manufaktur komponen listrik di Tiongkok bukanlah industri yang bersifat monolitik. Industri ini terdiri dari serangkaian klaster yang terkonsentrasi secara geografis, yang masing-masing telah memiliki kedalaman spesialisasi selama puluhan tahun. Kedekatan dengan bahan baku — tembaga, baja, polimer — serta dengan pemasok pelengkap di dalam setiap klaster diperkirakan dapat mengurangi biaya input sebesar 25–30% dibandingkan dengan produksi yang tersebar, sekaligus mempersingkat waktu tunggu secara signifikan.
| Klaster Manufaktur | Spesialisasi | Produk Unggulan | Catatan Pengadaan |
|---|---|---|---|
| Zhejiang — Yueqing / Wenzhou | Listrik tegangan rendah | MCB, MCCB, kontaktor, relai, sakelar, komponen rel DIN | Mendominasi 70%+ dari produksi listrik tegangan rendah (LV) di Tiongkok. |
| Guangdong — Shenzhen / Dongguan | Otomasi dan sistem kendali industri | PLC, sensor, konektor, PCB, panel HMI | Berfokus pada elektronik; unggul dalam perakitan SMT. |
| Jiangsu / Shanghai | Peralatan presisi & sistem kendali | Transformator, panel sakelar tegangan menengah, sistem pengendalian mesin industri | Kepadatan bidang teknik yang lebih tinggi; hubungan yang lebih erat dengan mitra usaha patungan multinasional. |
| Henan | Distribusi tenaga listrik & instalasi listrik skala besar | Trafo, pengatur tegangan, peralatan sakelar berdaya besar | Dekat dengan sumber pasokan bahan baku baja dan tembaga. |
| Shandong | Peralatan hemat energi | Trafo dengan kerugian rendah, pengendali motor, steker dan soket industri | Semakin meningkatnya spesialisasi dalam produk-produk hemat energi. |
| Hebei | Sistem elektromekanis | Peralatan pengangkat, transmisi daya, motor industri | Ahli dalam integrasi mekanis berskala besar. |
Waktu tunggu yang umum dari klaster-klaster ini: 7–15 hari untuk sampel, 20–35 hari untuk pesanan produksi standar, dan 45–60 hari untuk produk yang disesuaikan. Pengiriman udara menambah waktu 7–12 hari; pengiriman laut ke pelabuhan-pelabuhan utama di Eropa atau Amerika Utara biasanya memakan waktu 25–40 hari.
Klaster Yueqing patut mendapat perhatian khusus. Dalam radius 50 kilometer, seorang pembeli dapat memperoleh semua komponen yang diperlukan untuk merakit panel distribusi tegangan rendah yang lengkap — MCB, MCCB, kontaktor, relai, terminal, kotak pelindung, dan busbar — dari produsen yang telah berspesialisasi dalam sub-kategori masing-masing selama puluhan tahun. Kepadatan rantai pasokan di klaster ini memungkinkan pesanan multi-kategori sering kali dapat digabungkan di satu titik logistik, sehingga memangkas biaya pengiriman dan mengurangi beban administratif dalam mengelola hubungan dengan selusin pabrik yang berbeda.
Tarif, Kebijakan Perdagangan, dan Perhitungan Sumber Pasokan yang Baru
Jika pedoman pengadaan selama dekade terakhir adalah “cari harga satuan terendah dan kirimkan,” maka pedoman tahun 2026 dimulai dengan pertanyaan yang berbeda: “berapa sebenarnya biayanya setelah diperhitungkan tarif, biaya karbon, dan logistik?”
Lanskap kebijakan perdagangan telah mengalami pergeseran struktural:
Amerika Serikat. Tarif Pasal 232 atas kandungan baja dan aluminium menambah sekitar 50% pada komponen biaya bahan baku produk listrik yang terkena dampak. Tarif Pasal 301 atas komponen listrik asal Tiongkok berkisar antara 15% hingga 50%, tergantung pada klasifikasi HTS spesifiknya. Dampak gabungannya: suatu komponen yang harga pabriknya tampak kompetitif dapat berakhir dengan biaya total 30–60% lebih tinggi setelah dikenakan bea masuk.
Uni Eropa. CBAM, sebagaimana telah dibahas di atas, akan menambah 10–20% pada biaya efektif peralatan listrik yang intensif karbon begitu perluasan ke hilir mulai berlaku. Bahkan selama masa transisi saat ini, para importir Uni Eropa sudah mulai mensyaratkan dokumen emisi dari pemasok di luar Uni Eropa sebagai syarat untuk melakukan bisnis.
India. Kewajiban lokalisasi yang terkait dengan insentif untuk kendaraan listrik (EV) dan peralatan listrik mendorong produsen peralatan asli (OEM) baik dalam maupun luar negeri untuk melakukan pengadaan dari dalam negeri India, sehingga mengubah struktur rantai pasokan regional.
Tiga langkah praktis mulai muncul di kalangan para pemimpin bidang pengadaan:
- Kualifikasi multi-wilayah. Mempertahankan 2–3 pemasok yang memenuhi syarat untuk setiap kategori komponen kritis, yang tersebar di setidaknya dua yurisdiksi tarif, kini telah berubah dari praktik terbaik menjadi prosedur operasional standar. Ketika perubahan tarif secara tiba-tiba membuat salah satu rute pasokan menjadi tidak ekonomis, pemasok cadangan tersebut sudah memenuhi syarat dan siap untuk ditingkatkan skalanya.
- Nearshoring dan friend-shoring. Meksiko mulai muncul sebagai pusat nearshoring utama bagi kawasan Amerika, dengan kapasitas perakitan peralatan listrik yang terus berkembang guna membantu pembeli AS menghindari tarif impor dari Asia. Turki memainkan peran serupa bagi pasar Eropa dan Timur Tengah. Vietnam dan India sedang mengembangkan kapasitas sebagai alternatif dari Tiongkok untuk kategori produk tertentu, meskipun masing-masing negara memiliki risiko tarif dan keterbatasan kapasitas tersendiri.
- Pemodelan total biaya yang dibebankan. Harga satuan hanyalah titik awal, bukan jawaban akhir. Tim pengadaan sedang menyusun model biaya yang mencakup biaya angkut, bea masuk berdasarkan berbagai skenario tarif, biaya penyimpanan persediaan, risiko pengerjaan ulang akibat masalah kualitas, serta potensi waktu henti akibat gangguan pasokan. Pemasok yang mampu memberikan data biaya total setelah tiba (landed cost) secara transparan—bukan sekadar harga FOB—lah yang semakin diutamakan.
Satu faktor mendesak lainnya: para analis industri memperingatkan bahwa potensi alokasi — pembatasan pasokan — dapat kembali terjadi paling cepat pada kuartal pertama 2026. Saat ini, waktu tunggu untuk komponen analog mencapai 10–26 minggu, sensor 20–54 minggu, dan pengontrol tertentu hingga satu tahun penuh. Kesempatan untuk menegosiasikan perjanjian pasokan jangka panjang yang menguntungkan selagi pasar masih berpihak pada pembeli semakin menyempit (Beroe, 2025).
Cara Mengevaluasi dan Memilih Pemasok Komponen Listrik yang Tepat
Pengetahuan pasar dan wilayah pengadaan merupakan masukan. Hasilnya — keputusan yang benar-benar memengaruhi bisnis Anda — adalah pemilihan pemasok. Kerangka kerja di bawah ini dirancang agar dapat langsung diterapkan.
Kartu Penilaian Pemasok Empat Dimensi
| Dimensi | Hal-hal yang Perlu Diperiksa | Tanda-tanda Peringatan |
|---|---|---|
| Kepatuhan Teknis | Sertifikasi CE, UL, CCC, dan RoHS dengan nomor standar yang spesifik (IEC 60947 untuk panel distribusi tegangan rendah, IEC 61439 untuk rakitan, IEC 60076 untuk trafo). Minta laporan pengujian pihak ketiga: ketahanan dielektrik, kenaikan suhu, dan ketahanan terhadap arus pendek. | Tidak dapat menunjukkan dokumen sertifikasi yang dapat diverifikasi. Klaim umum (“bersertifikat CE”) tanpa mencantumkan nomor direktif atau standar yang spesifik. |
| Kapasitas Produksi | Luas pabrik, jumlah jalur produksi, tingkat otomatisasi (jalur SMT, peralatan CNC), keragaman SKU. Kemampuan menangani berbagai kategori produk memungkinkan pengurangan jumlah pemasok. | Tidak bersedia membagikan foto pabrik atau mengadakan tur video. Fasilitasnya dijelaskan, tetapi tidak ada peralatan yang terlihat. |
| Kontrol Kualitas | Riwayat inspeksi pihak ketiga (SGS, TÜV, Bureau Veritas). Sistem penelusuran batch. Pemantauan tingkat cacat yang terdokumentasi serta proses tindakan korektif. | Tidak ada riwayat pemeriksaan oleh pihak ketiga. Tidak ada prosedur pengendalian mutu yang terdokumentasi. Tidak dapat menjelaskan proses pemeriksaan bahan baku yang masuk. |
| Keandalan Operasional | Tingkat ketepatan waktu pengiriman ≥97%. Waktu respons atas pertanyaan ≤3 jam. Tingkat pemesanan ulang pelanggan >25% (indikator kepuasan). | Waktu respons secara konsisten lebih dari 24 jam. Kinerja pengiriman lebih didasarkan pada laporan anekdotal daripada pengukuran yang sebenarnya. |
Dari Perjanjian Percobaan hingga Kemitraan Strategis
Kualifikasi pemasok bukanlah proses pemeriksaan yang dilakukan sekali saja. Ini merupakan proses yang dilakukan secara bertahap:
Tahap 1 — Validasi sampel (1–5 buah, 7–15 hari). Mintalah sampel produk dan, untuk kategori-kategori penting, lakukan pengujian laboratorium independen terhadap parameter-parameter utama: resistansi isolasi, perilaku siklus termal, serta ketahanan tegangan. Pastikan spesifikasi bahan — lilitan tembaga versus aluminium, serta tingkat aditif tahan api dalam bahan plastik.
Tahap 2 — Produksi percobaan (10–50 buah). Uji konsistensi pemasok melalui proses produksi dalam skala kecil. Tahap ini akan menunjukkan apakah kualitas sampel tersebut hanya terjadi sekali saja atau memang mewakili kualitas secara umum. Pantau kualitas komunikasi, keakuratan dokumentasi, dan kepatuhan terhadap jadwal yang dijanjikan.
Fase 3 — Produksi skala besar. Baru setelah dua tahap berjalan dengan sukses, seorang pemasok seharusnya dijadikan saluran pengadaan tetap. Bahkan pada tahap ini, inspeksi berkala oleh pihak ketiga dan pemantauan tingkat cacat secara berkelanjutan tetap sangat penting. Kinerja pemasok dapat mengalami penurunan seiring berjalannya waktu, dan satu-satunya cara untuk mengantisipasinya adalah melalui pengukuran.
Membangun Kemitraan Strategis, Bukan Sekadar Daftar Pemasok
Langkah yang paling berdampak besar dalam pengadaan peralatan listrik industri bukanlah mencari harga satuan yang sedikit lebih rendah. Melainkan melakukan konsolidasi dari banyak pemasok transaksional menjadi sejumlah kecil pemasok strategis. Seorang distributor yang mengelola hubungan dengan 10–20 pabrik terpisah harus menanggung beban tersembunyi berupa biaya komunikasi yang berlebihan, fragmentasi logistik, ketidakkonsistenan kualitas, serta kehilangan diskon volume. Seorang mitra multi-kategori tunggal yang mencakup jangkauan produk yang luas melalui satu hubungan bisnis, satu titik logistik, dan satu sistem kualitas dapat menghilangkan sebagian besar beban tersebut.
Kartu penilaian pemasok di atas dapat digunakan untuk mengevaluasi produsen mana pun. Pertanyaan strategisnya adalah apakah Anda akan menggunakannya untuk menyusun daftar panjang pemasok dalam satu kategori saja, atau daftar pendek mitra yang dapat tumbuh bersama bisnis Anda. Dari segi perhitungan, daftar pendeklah yang lebih menguntungkan.
- 10–20 hubungan dengan pemasok yang harus dikelola
- Logistik yang terfragmentasi dan biaya pengiriman
- Kualitas yang tidak konsisten di berbagai pabrik
- Satu hubungan, satu sistem mutu
- Logistik terpadu, biaya pengiriman lebih rendah
- Diskon volume untuk semua kategori
Jika Anda sedang menyusun daftar calon pemasok berdasarkan kerangka kerja di atas, sebaiknya bandingkan beberapa katalog secara berdampingan. OMCH mencakup 30 kategori produk dan lebih dari 3.000 SKU dari satu sumber — sebuah model yang dirancang untuk mengurangi jumlah hubungan dengan pabrik yang harus dikelola oleh distributor.
Daftar Pustaka
- Fortune Business Insights. “Ukuran Pasar dan Pangsa Pasar Komponen Listrik Industri — Perkiraan 2026–2034.” 2025. https://www.fortunebusinessinsights.com/industrial-electrical-component-market-112628
- Mordor Intelligence. “Analisis Pangsa Pasar Komponen Listrik Industri — Perkiraan Pertumbuhan 2025–2030.” 2025. https://www.researchandmarkets.com/reports/6074471/industrial-electrical-component-market-share
- 6Wresearch. “Pasar Komponen Listrik Industri Global (2025–2031).” 2025. https://www.6wresearch.com/industry-report/global-industrial-electrical-components-market
- IEA. “Efisiensi Energi 2025 — Sektor Industri.” 2025. https://www.iea.org/reports/energy-efficiency-2025/industry
- TTI MarketEYE / Paumanok. “Komponen Pasif Kelas Industri: Pasar, Teknologi, dan Peluang pada Tahun 2026.” 2026. https://www.tti.com/content/ttiinc/en/resources/marketeye/categories/passives/me-zogbi-20260507.html
- CIGRE. “Harmonisasi Metodologi EPD dan CBAM untuk Penghitungan Jejak Karbon Trafo Listrik.” 2026. https://www.e-cigre.org/publications/detail/c3-11102-2026-harmonizing-epd-and-cbam-methodologies-for-carbon-footprinting-of-power-transformers.html
- Beroe. “Realitas Tarif Baru: Bagaimana Perubahan Perdagangan Global Mengubah Pola Pengadaan Peralatan Listrik.” 2025. https://www.beroeinc.com/resource-centre/insights/new-tariff-reality-how-global-trade-shifts-are-rewriting-electrical-equipment-sourcing/
- OMCH. “Komponen Otomasi Industri — Halaman Utama Perusahaan.” https://www.omch.com/

 English
  Arabic
  Turkish
  Russian
  Spanish
  French
  Indonesian
  Portuguese
  Thai
Thai  Vietnamese